Energy Department Announces New SunShot Projects to Harness the Power of Big Data

US-Department-of-Energy-logoEditor’s note: The following announcement from the Department of Energy provides context on a potentially very virtuous use of advanced data analysis capabilities to help solve real-world challenges regarding energy costs in the US. Before you get too excited about the potential here, remember to read the details. As you dig deeper into the list of projects you will note some potential for continued government-contractor goofiness and waste, like giving $600k to SRI to have them develop new software to read scientific publications. Seems like they could just buy some basic discovery tools for that or if they wanted to really use advanced big data tools could start by leveraging the Apache Hadoop framework first. So read the below but remember, the devil is in the details- bg

Energy Department Announces New SunShot Projects to Harness the Power of Big Data

January 30, 2013 -release

As part of the Energy Department’s SunShot Initiative, the Department today announced seven data-driven projects to unearth new opportunities for reducing costs and accelerating solar energy deployment in the United States. These projects—located in California, Colorado, Connecticut, Massachusetts, North Carolina and Texas—will result in viable methods for dramatically transforming the operations of solar researchers, manufacturers, developers, installers, and policymakers, and speed the commercialization and deployment of affordable, clean solar energy.
“Through powerful analytical tools developed by our nation’s top universities and national labs, we can gain unparalleled insight into solar deployment that will help lower the cost of solar power and create new businesses and jobs,” said Energy Secretary Steven Chu. “Projects like these will help accelerate technological and financing innovations—making it easier for American families and businesses to access clean, affordable energy.”
The Energy Department will invest about $9 million across the seven projects announced today. These efforts will help scientists, project developers, installers, and communities work together to discover previously unexplored ways to improve solar cell efficiency, reduce costs, and streamline installation processes.

Harnessing Real-World Data to Solve Industry Challenges

As part of the investment announced today, the Energy Department will provide $7 million to research teams led by Sandia National Laboratories, the National Renewable Energy Laboratory, Yale University and the University of Texas–Austin. These teams will partner with public and private financial institutions, utilities, and state agencies to apply statistical and computational tools to industry problem-solving and lead regional pilot projects across the country to test the impact and scalability of their innovations.
For example, Yale University researchers will partner with SmartPower’s New England Solar Challenge to design and implement innovative strategies that can increase the effectiveness of community-led bulk solar purchase programs. The team from the University of Texas–Austin will work with complex datasets from six Texas utilities to better understand customer needs and identify opportunities to streamline installation and interconnection. Similarly, the National Renewable Energy Laboratory in Golden, Colorado, will lead another project with Clean Power Finance to develop a computational model that will analyze data from over 1,300 solar installation companies to establish new types of community- and regional-scale financing structures.

Charting Market Evolution and Technology Innovation

Additionally, the Energy Department is investing $2 million across three projects led by the University of North Carolina–Charlotte, Massachusetts Institute of Technology, and SRI International to analyze decades’ of scientific publications, patents and cost and production data. Through these projects, researchers will be able to obtain a complete picture on the U.S. solar industry, discover methods to accelerate technological breakthroughs, and remove roadblocks to greater cost reduction.
Based in Menlo Park, California, SRI International will develop advanced software that reads and analyzes thousands of scientific publications and patents to discover new ways to speed solar energy technology innovation and commercialization. Meanwhile, Massachusetts Institute of Technology and the University of North Carolina–Charlotte will apply computational tools to patent, cost, and production data to speed up solar technology cost reductions and better forecast future cost reductions for new energy technologies.
The seven projects announced today will provide new insights that could dramatically accelerate the commercialization of affordable, reliable clean energy technologies. See the full list of projectsPDF.
The SunShot Initiative is a collaborative national effort to make solar energy cost-competitive with other forms of energy by the end of the decade. Inspired by President Kennedy’s “Moon Shot” program that put the first man on the moon, the SunShot Initiative has created new momentum for the solar industry by highlighting the need for American competitiveness in the clean energy race. For more information, visit www.energy.gov/sunshot.

Original Source :http://ctovision.com/2013/01/energy-department-announces-new-sunshot-projects-to-harness-the-power-of-big-data/

Technology Innovation in 2013: A Business and IT Priority

The proper use of technology enables businesses to be more efficient. Our recent research into technology for business innovation found that 56 percent indicate innovative technology is very important, yet only 9 percent are very satisfied with theirs, showing plenty of room for improvement. As we enter 2013, businesses have more choices than ever for technology to improve business and IT. Our firm has identified six key technologies that give organizations significant competitive advantages: big data, business analytics, business and social collaboration, cloud computing, mobile technology and social media. Our research agenda for 2013 is designed to help organizations assess and analyze these technologies and make the best possible decisions.
Big Data
vr_infomgt_information_management_initiativeBig data helps business and IT organizations manage and use information. Our technology innovation research finds only 14 percent of businesses today are very satisfied with their existing big data technology. At the same time, organizations that utilize big data effectively have improved their business significantly, according to 28 percent of organizations. Our research in 2013 will build on our assessment of big data in 2012. We will do a benchmark research study on big data analytics and another on information optimization. We see that organizations are investing in information assets that require big data and the analytics associated with it to refine information and optimize business activities. Big data can have significant business value, but using it requires that IT coordinate with business on the benefits they can achieve. Making a business case for an investment in big data technology can help organizations address the top issue of it being too expensive, as found in almost half (44%) of organizations. At the same time, organizations need to ensure they have the competencies to meet big data needs, which 
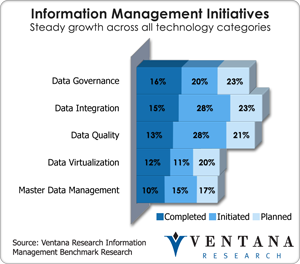
include not just the technology for storage and access but also underlying information management issues such as data governance, data integration and data quality, which our research in 2012 found are still in embryonic form in most organizations.
Business Analytics
vr_predanalytics_predictive_analytics_obstacles
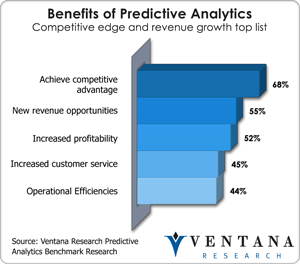
Our recent research on technology innovation found business analytics to be the top-ranked priority, and very important to more than half (52%) of organizations. Business analytics is not just a technology to get metrics faster but a set of processes to operate smarter with information, to better visualize and apply advanced methods such as predictive analytics, and to identify ways to better search and present information for a broad range of business constituents. Our research finds only half (51%) of organizations are satisfied with their existing processes due to lack of skilled resources. More than half of organizations say analytics are too hard to build and maintain or data is not readily available. The most time-consuming aspects of the process are data-related ones, according to 44 percent of organizations. The technology too still has room to improve, with only 20 percent being very satisfied. The most critical capabilities are in the areas of predictive analytics (49%), visual discovery (48%) and taking action on the outcomes of the analytics (46%). We also found in our next-generation business intelligence research that the use of mobile technologies such as tablets is growing across organizations. We also found in our research a high priority to use social collaboration technology with business analytics to work together on making improvements in shorter period of time than traditional email or phone calls. Our research agenda in 2013 will investigate big data analytics and next-generation business analytics approaches building on top of our research on predictive analytics, which found that organizations still struggle to integrate predictive analytics with information architectures to support analysts and data scientists. Advancing the competencies and focusing on analytics are critical processes, but businesses also need simpler communication of results to help those responsible understand situations and consider potential recommendation actions. We hope that technology suppliers will work to better align to the human dynamics of what really happens with analytics to better support communicating observations and insights to ensure that end goals are achieved.
Business and Social Collaboration
vr_socialcollab_supports_talent_managementThe revolution in social media has expanded into business, bringing with it social collaboration and helping business processes by connecting people to achieve goals personally, departmentally or across an organization. This new technology was ranked the second most important technology in our research, but only 17 percent of organizations are very confident in their ability to use the technology well. With most organizations (86%) using shared folders and documents, it should be no surprise that part of the issue is related to technology. Organizations are evaluating new methods such as wall posting (45%), social recognition (41%), earning badges and awards (40%) and broadcast or Twitter-like capabilities (39%). With only a quarter of organizations being satisfied with their existing approaches, we see a lot of changes coming in 2013 in regards to the technologies selected and deployed. Our research in 2013 will examine where collaboration is critical in areas of human capital management, sales, customer engagement and even finance. Building on top of some groundbreaking research across business and vertical industries, we see business advancing rapidly with or without IT support, since business and social collaboration can be easily onboarded through the use of cloud computing. Unfortunately organizations are mixed in the methods they prefer to use to access collaboration – embedded in applications, through Microsoft Office, embedded within tools like business intelligence or stand-alone – making it complex to have consistency for users and their interactions. Using social collaboration with business analytics is a growing priority and organizations will need to assess their technologies to see if they meet this need. We believe that social collaboration will help bridge generational divides between workers as it becomes more easily accessible through web and mobile technologies, allowing managers and workers to engage anytime or anyplace. Focusing on the benefits of social collaboration, such as knowledge sharing, is critical as our research finds as the top need in 49 percent of organizations.
Cloud Computing
vr_datacloud_data_in_the_cloud_concernsOur research finds that businesses don’t see cloud computing as innovative technology but rather as a utility and becoming a standard method that can be easily accessed and leveraged as part of their portfolio of computing options. These faster methods to onboard applications have become easy and in most cases require little IT involvement. But beyond the simplicity for business and potential chaos for IT to eventually govern and support, the cloud computing environment is now a viable platform for IT to leverage in a multitude of methods, from IT infrastructure to developing and operating applications. The cloud computing environment can be used as a central point for integrating data and storing it for the enterprise or for customers and suppliers, but most organizations have not automated the integration of data to support business processes or business analytics and decision support. The lack of automation has increased concerns for data security, which 63 percent of organizations in our data in the cloud research find to be a major concern. In all of our research in 2012, the preference for cloud computing is growing across lines of business and especially in areas like sales, customer service and human capital management. In 2013 we plan to further assess the advancements in cloud computing, from big data and analytics to information that can be leveraged from a broad range of applications and services.
Mobile Technology
vr_ngbi_br_goals_for_mobile_bi_deploymentsThe use of smartphones and tablets has become common among consumers who are also workers in organizations. Mobile technology is a new platform on which organizations can deploy applications and tools for a wide array of business needs. Yet our next-generation workforce management research finds only 8 percent of organizations indicate they have everything they need on these technologies, and only a quarter more indicate they have most but not all they need available, which leaves a large number of organizations not able to meet their mobile business needs. This might be why only 20 percent are very confident in their use of mobile technology today. The debate on whether to use native applications and tools or operate across a web browser environment still looms, with native (39%) outpacing browser (33%) and a fifth having no preference. Bring your own device (BYOD) is another area of friction, where 39 percent of organizations allow this approach with smartphones and 45 percent with tablets. Organizations have many opportunities to determine how to use mobile technology effectively, and can derive many benefits. Our next-generation business intelligence research found increased workforce productivity was at the top of the list in 55 percent of organizations. Our research in 2013 will further investigate the use of tablets across the line of business, since this was found to have the largest growth planned (34%), while smartphones are more established.
Social Media
vr_socialcollab_factors_driving_use_of_social_mediaSocial media is a new path for organizations to use to expand their corporate footprint to a broader audience and to gain brand awareness by marketing products and services. This new channel of opportunity enables organizations to rethink how they operate many of their business processes, including the ones that they use to find new talent and track candidates into an organization. In 2012 our research into social media and recruiting found that only 7 percent of organizations are very confident in use of this channel, but half of organizations are planning to change how they use social media over the next year; for instance, 81 percent of organizations have identified it as a method to identify new talent pools. In 2013 we will continue to examine best practices and benefits of investments in this channel. We will also assess social media as a new channel for customers to engage with organizations through a new benchmark in next-generation customer engagement. Our research in 2012 found organizations benefit from using this channel to handle a broad range of customer questions and issues.
While new technologies can help business innovate, what’s old is still new, and requires a foundation of skills and resources. For example, with big data, those organizations that have information management competencies to automate big data efforts will find themselves further ahead, as they leverage the core skills of data integration to handle more data environments. Those organizations that use business and social collaboration to connect people and processes more efficiently than conference calls and email will better leverage their human capital investments.
At the same time new techniques can make it simpler to gain value from existing technology investments, such as advancements in the use of text to present analytics in a readable form, new methods to use visualization as a discovery tool on analytics, and the ability to engage employees by using new and more social collaborative methods. Taking advantage of this technology requires smart use of best practices, leadership from the top and agreement about the desired outcome. Organizations need to have technology in place to develop a business case with balanced evaluation criteria that are not about the vision a vendor has but rather about what the vendor can provide to advance business efforts. We use this practical approach in our vendor and product assessment methodology and rating called the Value Index which we will be assessing over 100 vendors in 2013.
vr_bti_br_barriers_to_use_of_innovative_technologyOrganizations should explore resources in the company to determine if necessary skill sets exist, since their lack is the top barrier to adoption of technology according to 51 percent of organizations as found in our research. Part of this process is ability to know whether the technology can adapt to the workers’ needs and capabilities, and whether it requires weeks of training. Organizations should also look to the future and examine how to use cloud computing to rent technology, and how to use mobile technology to enhance collaboration. They should also keep pace with peers and competitors through the use of benchmarks and industry comparisons.
You can depend on Ventana Research to provide sound facts and pragmatic guidance to help you leverage technology to gain a competitive advantage in your business and innovate in your processes and with your workforce.

Original Source http://marksmith.ventanaresearch.com/2013/01/29/technology-innovation-in-2013-is-a-business-and-it-priority/

How can Business Intelligence help cut costs?

A while ago I was discussing the economic slowdown with some fellow business intelligence (BI) experts. I vividly remember that somebody said, “The recession is an opportunity; it is the strongest business driver so far. BI will help companies find their weaknesses, help them find ways to cut costs and help them make smarter choices.” His final conclusion was, “The recession is a blessing in disguise for business intelligence.”
“Now is the winter of our discontent, made glorious summer by this sun of York,” Shakespeare wrote some 500 years ago, meaning that the time of unhappiness is a thing of the past. Now the question is whether BI can indeed make for a glorious future. The fact of the matter is that, blessing or curse for BI, the economy is going to dominate the market this year. As BI is still often executed within IT (and not business), it will therefore be seriously affected by the lowering of IT budgets. The result of this is that many projects will be cut or put on hold, resulting in a decrease of information supply. At the other end of the spectrum, we see business people screaming for more information as uncertainty grows. The paradox is that we find ourselves in a situation of increasing demand for information and less supply. This leads to the two major questions for BI this year: How can BI help cut costs and how can I cut costs on BI?
Fewer Products
I expect that many customers will move from best-of-breed solutions to BI platforms from one of the major vendors (Oracle, SAP, IBM and Microsoft) or take a good look at their BI product stack in order to save money. A reduction of the number of BI tools makes sense both from a financial as well as an organizational point of view. Off course, there will a danger of the so called vendor lock-in, but this is hard to prevent anyway. As an alternative, customers might go the road less traveled and evaluate open source BI solutions. While money is tight do not expect more major acquisitions from BI vendors. A further integration of acquired technology in the (BI) infrastructure, applications or processes will be the first objective of these companies.
Different Architectures
In time of trouble you need all the support you can get. I expect an increasing demand for relevant information and a need for faster decisions. Employees will connect with others inside and outside their company in order to share information. We also see that cooperation can work as strong stimuli for business innovation. Enablers of cooperation are architectures that allow for open markets of information and self-service solutions of (internal) customers. These solutions will be based on services and the free flow of information. These new requirements will set new standards for BI architecture as it moves away from traditional batch orientation toward more “right-time” or operational BI architectures supported by data warehouse appliances or cloud computing.
Management and Operational Excellence
With a lower budget comes a growing demand for cost cutting. This will raise the need for cheaper ways of building new information products and more cost-efficient ways for the maintenance of existing ones. IT departments must focus on operational excellence in order to lower the costs of their BI infrastructure. Innovation or management excellence will come from business departments, often using self-service solutions, while making use of proven industry templates and best practices.
Data Usage
Much of the (classic) BI infrastructure is already in place. With increased business need for information, now is the time to exploit this. Reporting is a commodity where companies can no longer realize much competitive advantage. On the other hand, monitoring (right-time BI) of operational processes will increase enterprise agility; therefore, I expect that business activity monitoring (BAM) and rules-based decision engines will begin to pop up. The most added value will be in analytics where data mining, statistics and business knowledge are combined to analyze current and historical performance in order to predict the future. I expect the bulk of the investments will e in this area.
Overcoming Differences
On a final note, it must be said that in these times no organization can afford to be caught in internal or external disputes. Therefore, it is wise to overcome any differences. The first and most obvious one is the discussion of BI cost versus BI benefit. As the return on intelligence is more and more disputed I expect to see an increased demand for business cases. The second one is the gap between the IT department and the business departments. This will lead to an increased need for alignment within some sort of a BI competency center. The third and final one is finance versus the rest. Finance will control the budget and will remain in the driver seat for all cost-cutting programs. They have taken the lead in the majority of all BI solutions. The CFO will be the sparring partner for new BI initiatives and the CIO will be the sparring partner if BI infrastructure is on the agenda.
The economic slowdown will dominate the BI market leading to a decrease in information supply (IT) and an increase in information demand (business) with cost cutting as the #1 objective. We will see customers standardizing on one vendor and a rationalization of their BI products. The increased demand for faster answers and a need to connect with stakeholders will impact BI architecture as we know it. IT will look for more cost-effective ways for delivery and maintenance of BI solutions. Self-service will be demanded by business to cope with the new tasks at hand. More value will be extracted from current BI infrastructure with strong investments in analytics. Finally, all classic differences have to be overcome to face these difficult times. We will see an increased need for business cases, IT and business alignment and a leading role for finance.

Original Source :http://www.capgemini.com/technology-blog/2013/01/business-intelligence-cut-costs/

RSA adds Big Data analytics to security service suite

In just under a month, security folks are coming to San Francisco for the annual RSA show, and if Wednesday's announcement from the company is to go by, one of the major themes at conference will be Big Data.
At a press conference at its Massachusetts headquarters, RSA unveiled its Security Analytics appliance that's designed to plug into large corporate networks and churn through huge chunks of data looking for security problems. RSA has also included real-time malware detection, threat monitoring, and heuristic analysis, so consultants can get an accurate read on any threats as they happen.

"It's all about mixing full monitoring capabilities with compliance and reporting in a fully scalable architecture," Paul Stamp, director of product marketing at RSA told The Register. "It's the first appliance on the market to do these kind of log analytics and data reconstruction."
The system uses a decoder to capture all layer 2-7 traffic with a concentrator to index metadata into a form usable by the analytics engine. A Hadoop-based warehouse of three or more nodes is included for long-term analysis of large data sets, and the system reports back with an HTML5 user interface.
RSA is also touting the system as helping with corporate compliance returns. Security Analytics is HIPAA and SOX-compliant, as well as being ready for BASEL II and ISO 27002, and can automate many of the reporting procedures needed.
RSA isn't the first in the security Big Data field, however. In October, IBM claimed that title with the release of its InfoSphere Guardium v9 for Hadoop security system. It seems more than a few vendors are keen to bring some of the Big Data hype to the security space.
"The Big Data phenomenon could help address this situation for security professionals, making it important for organizations to rethink their choice of security solutions," said Jon Oltsik, principal analyst at the Enterprise Strategy Group.
"Marrying intelligence-driven security with Big Data analytics has the potential to help enterprises address the complex problem of advanced threats and thus meet a significant need in the marketplace." ®


Original Source :http://www.theregister.co.uk/2013/01/31/rsa_security_analytics/

How Algorithms Changed The World


An infographic by the team at College Degree Search

Google News as an Analytic Database

I was browsing the L.A. Times digital newspaper recently and came across an interesting article entitled “Mexico,before and after Calderon’s drug war”. The horrific toll of Mexico’s war on drugs – over 50,000 deaths in the last six years alone – is well documented and much-attributed to then-President Felipe Calderón’s initiative launched in late 2006. 
The article cites a report “Drug Violence in Mexico” by The Trans-Border Institute at the University of San Diego, proposing, however, that the violence probably started several years before Calderon assumed office. This is important “because some critics argue that the Calderón administration launched its assault on drug traffickers as a political move to legitimize the adminis­tration after the controversial presidential election of 2006.”
What especially caught my eye was that one of drug violence report’s authors, doctoral candidate Viridiana Ríos, reached the earlier violence commencement conclusion by “combining available crime figures with ‘a multiple imputation algorithm and Bayesian statistics’ as part of her Ph.D. dissertation” in Government from Harvard University. Additional investigation of Rios led me to her current home at Harvard’s Institute for Quantitative Social Science, and an even more fascinating study, “Knowing Where and How Criminal Organizations Operate Using Web Content,” showcasing a new framework for political science research.
The “Knowing” paper introduces a methodology “that uses Web content to obtain quantitative information about a phenomenon that would otherwise require the operation of large scale, expensive intelligence exercises. Exploiting indexed reliable sources such as online newspapers and blogs, we use unambiguous query terms to characterize a complex evolving phenomena and solve a security policy problem: identifying the areas of operation and modus operandi of criminal organizations, in particular, Mexican drug trafficking organizations over the last two decades ... our findings provide evidence that criminal organizations are more strategic and operate in more differentiated ways than current academic literature thought.”
The authors propose an approach called MOGO – Making Order using Google as an Oracle – that engages both computer science and social science disciplines. The points of departure for MOGO are the search topics or “actors” of interest into categorized collections or “actor lists.” The lists are in turn combined into query sets. Finally, these sets are submitted to a “crawler” program that queries a knowledge base “oracle” and accumulates statistics for subsequent analyses.
For this investigation, the crawler is a Python program that uses a Google API to return JSON pages which are then parsed and “hits” tabulated. Google News, a generally reliable indexed source of newspapers and blogs, is the oracle that’s queried. The output from this step is then fed to a knowledge discovery process that validates, cleans and refines the data. “To clean, we normalized the total number of hits we are getting using a hyper-geometric cumulative distribution ... To validate, we compared information from other cases, cases in which information is known with certainty, with the one we extracted using MOGO.”
Based on analytics derived from the MOGO methodology, the “Knowing” research was able to articulate the geographic behavior of 13 drug-trafficking organizations in Mexico, including their migration patterns and “marketing strategies.” One provocative finding: “our information provides the first portrait of the market structure of the illegal drug trafficking within Mexico and of its changes over time. Mexico's organized crime is not the oligopoly the theoretical literature of organized crime and private protection rackets assumes; rather, drug trafficking organizations share territories frequently.”
All the data science pieces – computer science, social science and statistics – converge to identify the trafficking organizations’ “phenotype.” With the different characteristics that emerge from the refinement process, the study deploys the k-means clustering algorithm to identify four classes of trafficking organizations: “Traditional,” which have been in operation the longest; “New,” which emerged on average 10 years after Traditional; “Competitive,” which operate in territories where others are already trafficking; and “Expansionary Competitive,” which are both expansionary and explorative.
The paper concludes that the MOGO methodology’s a great starting point for gathering low-cost intelligence information. That MOGO passed several important “face validity” comparisons of its findings with known results of other investigations, says a lot about its computer science and statistics chops. And that its findings debunk several generally-held notions of the homogeneity of trafficking organization’ operations will get the attention of social science and policy researchers.
For me, this is more evidence of the tight emerging ties between the quantitative social science of academia and the data science of business. Very cool stuff.
 
Original Source : http://www.information-management.com/blogs/google-news-as-an-analytic-database-10023887-1.html

The Cost of Bad Data is the Illusion of Knowledge

Each time I open Salesforce in my browser, I think of Steven Hawking. It's because of an aphorism an entrepreneur shared with me a few weeks ago. He said:
> The cost to fix a data error at the time of entry is $1. The cost to fix it an hour after it's been entered is $10. And the cost to fix it several months later is $100+.
Take for example a venture capitalist's CRM tool. If I mistype an email address or the details of the last fund raise, it might cost me a minute or two to fix it at that very moment. A minute of time is worth about $1.
If I'm lazy and don't correct the error, later on that day one of my colleagues might search our CRM for the company and comes across the erroneous record which he suspects is inaccurate. First, he will check his notes, then he will call me to verify and then he will change the record. The rigamarole has undermined his trust of my data and the ten minutes he spent correcting my data entry are wasted.
Worst of all is if I contact a startup to inquire about an upcoming fund raise with incorrect data. As a result, I could miss an opportunity to partner with a great company because of incorrect timing or lose credibility with the startup's executive team. The cost to the firm could be in the tens of millions of dollars.
All because I was lazy updating the CRM record.
Data promises compounding returns. The more data you have on a customer or prospect or your own business, the better the insights you can draw and the better decisions you can make. But these returns are blind to the quality of data.
Bad data has equally great compounding effects. And as Hawking so succinctly put it:
“The greatest enemy of knowledge is not ignorance, it is the illusion of knowledge.” – Stephen Hawking

Original Source :http://www.linkedin.com/today/post/article/20130129163420-4444200-the-cost-of-bad-data-is-the-illusion-of-knowledge

Twitter Is Buying A Startup, Crashlytics, And Not Killing It Off For A Change

Twitter, the global network for short bursts of information, is buying a startup, Crashlytics, that tracks when bad code causes apps to fail abruptly.
Notably, it appears to be leaving Crashlytics alone. TechCrunch reports that Twitter is not relocating the team from Cambridge, Mass. to Twitter headquarters in San Francisco, and allowing it to continue to serve other customers like Yelp and Waze.
Twitter uses Crashlytics in its own app, as well as Vine, a recently launched app for sharing short, simply edited videos.
Which brings us to an interesting point: Is Twitter changing its acquisition strategy?
Twitter has primarily bought pieces of its own ecosystem, bringing in-house functions previously developed by third-party developers. Summize, a search engine for tweets, and Tweetie, the basis of Twitter's iPhone client, are prominent examples. Those deals have been largely successful, allowing Twitter users to find tweets and use Twitter-branded mobile apps.
It has also bought startups for their talent. Mixer Labs, a location-software startup; Posterous, a blogging platform akin to Tumblr; and Bagcheck, a list-sharing site, are two examples. Those results have been more mixed:
  • Mixer Labs CEO Elad Gil stayed for two and a half years, running corporate strategy. He left in May 2012.
  • Posterous CEO Sachin Agarwal played a key role in Twitter's new photo features.
  • Bagcheck cofounder Sam Pullara stayed for just a year on Twitter's engineering team.
With Crashlytics and Vine, Twitter is setting a new pattern: Buying startups and leaving them alone to develop products in Twitter's safe nest.
The model here is Google's acquisition of Android and YouTube, which it ran for years as standalone divisions.
Twitter's motives may vary deal by deal. As a Crashlytics customer, it may not have wanted the startup to end up in the hands of hostile rivals like Google or Facebook, who surely wouldn't mind learning about the ins and outs of Twitter's mobile-app code.
Vine, on the other hand, seems to have simply charmed Twitter's leaders with the premise of a new art form, a video version of Twitter's 140-character tweets.
But whatever the specific reasoning to buy a company, it's very interesting that Twitter's breaking from the acquire-hire pattern of buying startups and crushing what makes them unique.

Google Makes Using Analytics Easier With New Solution Gallery For Dashboards, Segments & Custom Reports

Google Analytics is such a powerful tool, its huge feature set can often be intimidating for novice users. Now, however, with today’s launch of the creatively named Google Analytics Solution Gallery, Google is hoping to make many of the service’s advanced features a bit more accessible to new users. The Solution Gallery features pre-made dashboards, advanced segments and custom reports for a wide range of businesses, including e-commerce sites, brands and publishers.
From the Solutions Gallery, users can easily select what kind of analytics solution they are looking for (dashboard, custom report or advanced segment), what their business objective is (publisher, brand, lead generation, etc.) and what marketing function they are trying to analyze (SEO, social sharing, mobile, etc.). In total, the gallery currently features 31 different solutions, including a social sharing report, a publisher dashboard for bloggers and some good examples of advanced segments.
Advanced Blog DashboardEven though the link underneath the different options is called “download,” a click on one of these simply installs the new functionality right in your Google Analytics account.
As Google Analytics team member Ian Myszenski notes in today’s announcement, the company hopes that this will help Analytics users to “filter through the noise to see the metrics that matter for your type of business.” He also writes that Google plans to expand this list with new solutions over time.

Original Source  :http://techcrunch.com/2013/01/28/google-makes-using-analytics-easier-with-new-solution-gallery-for-dashboards-segments-custom-reports/

What’s Missing? Game-Changing! Visualize That! You Get What You Pay For

What’s Missing From Your BI?

This week? Two things:
  • First, a real understanding of how people create and use information, according to a Harvard Business Review article entitled Why IT fumbles Analytics
  • Second, Forrester analyst Boris Evelson says you should have BI on BI (SAP BusinessObjects supports the types of analysis cited, and Information Steward is a dedicated product for data governance)


Just Don’t Call It A Game Changer

As Jaspersoft is kind enough to point out, analytics firmly embedded inside applications are the future, and so, inspired by Jessica Hagy of thisisindexed, I again portrayed SAP HANA as a game changer, despite the feline casualties.
You don’t buy it? Well how about if it’s illustrated by a bizarre tron-like 3D race around a pinball universe? (complete with American-game-show-host-announcer-voice)
Still not? Then how about when John Appleby of Bluefin explains it in his BW on HANA Frequently Asked Questions blog: “SAP HANA is much faster than regular relational databases like Oracle or Microsoft SQL Server, the data warehouse performs much faster – but more than that, it’s cheaper as well.”
Still have questions? See if yours match those of the participants of the recent HANA SAPChat compiled by Dorothea Sieber.
Confused as to where the product fits in with the long list of other SQL and non-SQL databases? This map may help (or not).
At least one thing IS clear: Forrester Researcher agrees that SAP is one of the “clear leaders in the big data analytics space”.
Convinced now? Good. To get started fast, follow Josef Minde’s instructions on how to get up and running on SAP HANA in less than an hour using AWS. And as Greg Chase points out, this makes SAP HANA as convenient as a light bulb because you can simply “switch it off when you leave the room, and on again when you come back.” Talk about illuminating insights…

Oh Yeah? Visualize That!

nfl player of year smallCould it really be that pie charts might not be as irredeemably awful as we’ve been told (or is that only for certain unusual tasks?)
Stephen Few recently organized a dashboard competition. After the winners were announced, he said “I don’t feel that I should judge the efforts of others unless I’m willing to submit my own work for scrutiny as well” – and went on to explain why his own dashboard is better than the other entries (“let’s consider a few ways that this design succeeds where others fell short”).
The National Football League website gets new fan-pleasing analytics powered by SAP, including a fantasy football analytic experience build by Drew LeBlanc. There are no pie charts, as far as I know, but ink-to-data ratio proponents won’t be happy. However, it will hopefully score highly on Donald MacCormick’s formula for effective dashboards: Total value of a dashboard = number of views x average value per view.

Talking of Superior Performance…

‘Tis the season of performance reviews, which most people hate. It wasn’t always so, says this infographic of performance review history. And if you believe the conclusion that “social performance management” is the way to go, then you should take a look at SAP SuccessFactors with SAP Jam (SAP employees are moving to the system for this year’s goal-setting).
To help you achieve this year’s goals, a new SAP Jam video goes over the use cases for Enterprise Social in sales, service, and marketing. The key is to integrate social within existing work processes — as Chris Horak put it this week: “collaboration without context is just chatter..” Might that be why Salesforce is playing down social on its home page?

But Is it Safe?!

Yes, your data is secure in the cloud. As explained by Lars Dalgaard on a recent kickoff call, SuccessFactors has thousands of customers, and by pooling resources, can spend a lot more time and money than any individual company could. After all, it’s just like your bank: they do a better job of keeping your money safe than you can — and there’s an encryption option, so access would be useless anyway.
I might be a bit cynical, but I suspect it’s not the technical arguments that will count in most organizations – it will be whether other reputable companies have already made the leap. So why not join Pepsi’s 300,000 employees in the cloud?

In-Helix Processing?

Researchers say you can squeeze 2.2 Petabytes of information into a single gram of DNA. It’s clear that you can use MapReduce to analyze DNA and help treat cancer, but DNA computers may be able to diagnose cancer directly. Will it be long before somebody comes up with a way to replicate the MapReduce algorithm using DNA strands, for “In-Helix processing”?

It Sucks To Be Deluded

Sadly, it turns out that data just isn’t enough to sway incorrect opinions – if anything, people double-down.

You Got What You Paid For, So Why Are You Complaining?

Design thinking to improve the customer experience is all the rage, but how much of it comes down to “you get what you pay for”?
It seems that there might sometimes be a clash between “analytics” and “social”. For example, today’s airlines have great analytics, and they seem to have concluded that, for whatever reason, people generally prefer low prices instead of a pleasurable flight. After all, it IS possible to have a wonderful flying experience: just travel in first class, or jump in a private jet. But most of us have concluded that we’re not willing to pay the price. Another example: if you chose not to pay the premium for a changeable ticket, is it reasonable to complain on twitter about change fees?
People clearly assume change fees are only about administration costs, and so are outraged when a change costs more than the original ticket. But airlines brandish the threat of fees as a price differentiation mechanism – which means that your cheap non-changeable flight is essentially subsidized by the business person who is not sure when his meeting will end.
But as sentiment analysis guru Seth Grimes points out, the challenge is passenger perception: “people decline an demand to pay more for a seat that doesn’t cost an airline any more“ and “injury is added to price-gouging insult.”
Companies have long used marketing techniques to overcome strictly rational thinking. “Underserved” criticism on social media might just be the flip side of this effect, and may start swaying packaging choices (e.g. as with enterprise selling, companies may start with a higher price and then offer discounts, rather than using a low price and expensive addons) – call it “offer social engineering”

Enterprise Mobile is Dead Already?!

The End of the Mobile Enterprise Market Starts Now according to analyst Joshua Greenbaum (because it’s about touch and user experience, not the device).

Top Ten SAP Analytic Posts From Last Year

I guess I’ll have to try harder to get on this list next year (although I do think this list of analytics twitter influencers is deeply flawed)

Actuate Makes Big Play with BIRT Analytics


Actuate this week announced BIRT Analytics, and thereby puts itself firmly into supporting a range of business analytics needs from data discovery and visualization to a range of data mining and predictive capabilities that allows itself new avenues of growth. Actuate has long been a staple of large Business Intelligence deployments; in fact the company says that ActuateOne delivers more insights to more people than all other BI applications combined. This is likely true, given that Actuate is embedded in major consumer applications across industries worldwide. This announcement builds and utilizes its advancements into big data that I already assessed last year that can help it further expand its technology value to business and IT.
Tools such as BIRT Analytics can change the organizational culture aroundvr_ngbi_br_importance_of_bi_technology_considerations data and analytics. They put the power of data discovery and data visualization into the hands of tool-savvy managers as well as business analysts.  While Actuate has allowed highly functional and interactive dashboards in the past, BIRT Analytics brings the usability dimension to a different level. Usability is of the highest importance to 63 percent of organizations for business intelligence software, according to our next-generation business intelligence benchmark research, and one where BIRT Analytics and other tools in its class really show their value. The technology allows not just for visual data exploration, but also for new sources of data to be connected and analyzed without a predefined schema. This fits well with the current world of distributed computing, where everything can no longer be nicely modeled in one place. The software can gather data from different sources, including big data sources, flat files and traditional relational databases, and mash these up through visually appealing toolsets, allowing end user analysts to bypass IT and avoid much of the data preparation that has been a hallmark of business intelligence in the past. In fact our recent business technology innovation benchmark research shows that only a little more than half of companies are satisfied with their analytic processes, and 44 percent of organizations indicate the most time-consuming part of the analytics process is data-related tasks that Actuate is addressing with their ability to handle data efficiently.
Some of the advantages of the BIRT Analytics product are its fast in-memory engine,vr_predanalytics_benifits_of_predictive_analytics its ability to handle large amounts of data, and the more advanced analytic capabilities in the system. The company’s web site says it offers the fastest data loading tool in the industry with the FastDB main memory database system and an ability to explore 6 billion records in less than a second. These are impressive numbers, especially as we look at big data analytics, which often runs against terabytes of data. The usability of this tool’s analytics features is particularly impressive. For instance, set analysis, clustering and predictive capabilities are all part of the software, allowing analysts who aren’t necessarily data scientists to conduct advanced data analysis. These capabilities give tools like BIRT Analytics an advantage in the market since they offer simple end-user-driven ways to produce market segmentation and forecasting reports. These advancements help Actuate provide new benefits of its BIRT Analytics that according to our benchmark research on predictive analytics, 68 percent of organizations see predictive analytics as a source of competitive advantage.
Actuate already ranked as a hot vendor in the 2012 Ventana Research Business Intelligence Value Index thanks to its enterprise-level reliability and validation of its deployments which this release will help it even more in its ratings.  In the short term, BIRT Analytics will certainly boost Actuate’s market momentum and allow it to compete in areas where it would not have been seen before and help it expand its value to its existing customers.

Original Source :http://tonycosentino.ventanaresearch.com/2013/01/25/actuate-makes-big-play-with-birt-analytics/