After the provincial and municipal elections
of the 14th of October in Belgium, media reported several cases of
candidates who had received more preference votes than what normally
would have been expected. The additional votes were attributed to a
problem with the touch screens of the voting machines. When voters
pressed too long when selecting a party, the system would sometimes
register a preference vote for the candidate whose name appeared in the
same area as where the party was. The figures below illustrates well
what the issue is.
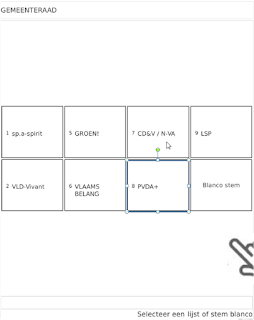
The
figure on the left is the Parties Screen, i.e. the first screen the
voter sees. On that screen the voter selects a party (sometimes called a
list). In this case, the voter has selected the PVDA+ party, as
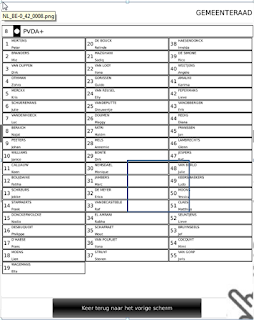
indicated by the blue rectangle. The figure on the right hand side is
the candidates screen, i.e. the subsequent screen the voter sees. This
screen shows all the candidates for the party that was selected in the
previous sceen.
It was reported that in some cases, especially
when the voter pushed too hard or too long, the second screen would
register a preference vote for the candidate at the same location on the
screen as where the party name was (also indicated with a blue
rectangle). For simplicity's sake we will call the position that
corresponds with the exact location where the party name was a
hotspot.
While
some individual cases of remarkbable results were widely reported in
the newspapers, a more thorough investigation of the problem was, as far
as I know lacking. This effectively means that the magnitude of the
effect was unknown.
As a data scientist that's the kind of
question that you would find interesting; you would wonder how big the
"Touch Screen Effect" was. That's exactly what I did in a paper you can
download
here. In this blog post I'll try to summarize what I did, focussing on the Data Science aspects.
The
first problem is to get the data. While a lot of (news-)websites
offered web applications to retrieve the results of the elections in a
meaningful way, none of them allowed me to download the complete set of
results, i.e. for each candidate, on each list (or party), in every
municipality of the Flemish part of Belgium, the number of preference
votes was needed.
So I wrote a Python script to scrape the data from one of those websites. I used the
BeautifulSoup and
Selenium packages for that. If the hypothesis of a "Touch Screen Effect" is true we would expect a higher number of votes on
hotspots
than on the other positions. So the second problem becomes: "What is
the expected number of votes for a given candidate on a given position,
on a given list (or party) in a given municipality?"
For reasons
that are detailed in the paper we chose to model the natural logarithm
of the share of vote of a candidate (relative to his or her party in his
or her municipality) with a multilevel regression model based on a
polynomial of the third degree of the position of the candidate on the
list. The polynomial is needed to capture the curvilinear nature of the
data. Typically the candidates on top of a list, and the candidates at
the bottom of the list receive more votes than those in between. The
computations were done in R, using the
LME4 package. Those who are interested can find the formulas in the original
paper.
The figure below illustrates this curvilinear nature for a random
selection of 9 party-municipality combinations. The red line comes from a
local regression model, the green line is the multilevel model that was
used in the final analysis.

So
far, so good. The third problem is to decide on what constitutes an
exceptional share of vote. Here we use the standardized residuals, as
calculated by the
LMERConvenienceFunctions in R (this is
because in mixed models the calculation of standardized residuals is not
that straightforward). Values above 2 are considered as being outliers.
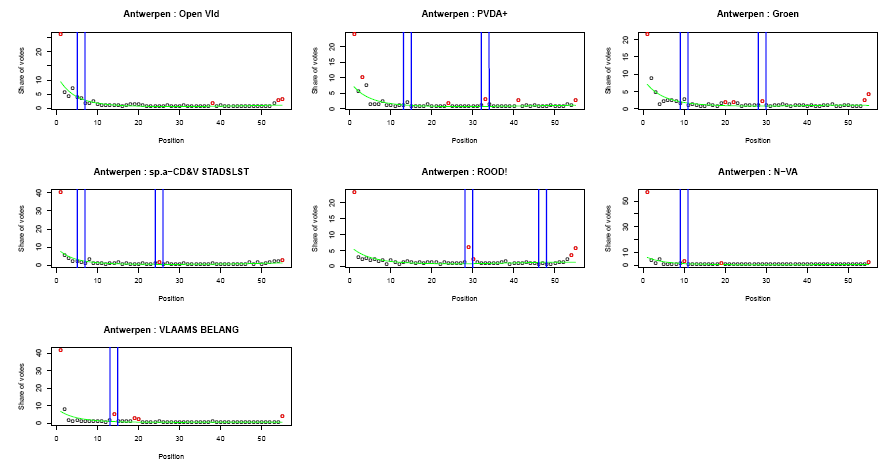
With
these three problems solved we can show the results for the main
parties in the city of Antwerp (see below). The black points are the
share of votes of the candidates (expressed as percentages) in function
of the position of the candidate. The red points are those that are
considered to be outliers, using the criterion descussed above. The
green line is is the multilevel regression line.
Hotspots are
indicated by two blue vertical lines. Notice that in this figure the
first 4 positions were omitted (for a justification, see the original
paper).

In the figure above we see that all parties, except
Open Vld, have an outlier that happens to be on a
hotspot. There are a few parties that have more than one
hotspot, while only one of them is actually an outlier. And finally, there are some outliers that are not on a
hotspot.
The latter observation should not come as a surprise. Exceptional
election results can be attributed to lots of things, such as running a
good campaign, being famous, and so on. In other words, the fourth
problem is that we need to take into account that outliers could also
just accidentally be on a
hotspot.
The approach I'm using is based on the calculation of some simple conditional probabilities. The probability for a
hotspot
in Antwerp to be an outlier (i.e. have substantially more votes than
expected based on the position on the list) is about 55%. The
probability for a normal (non-hotspot) position to have an outlier is
7%. The ratio between the two is 7.5. This means that the probability to
have an exceptionally high share of votes (i.e. being an outlier) is
7.5 times higher for a
hotspot than it is for a normal position.
It
must be said that not all municipalities have the same spectacular
effects as in Antwerp. On the other hand we should also stress that
estimates are probably conservative. One of the reasons that this is the
case is that the regression model is generally good, except for the
first and last position. This effectively means that there are quite a
lot of outliers on those two positions, while those positions are not
relevant from the perspective of the Touch Screen issue. We can
calculate less conservative estimates by disregarding the first two
positions and the last two positions. Also, my approach doesn't work
well for smaller municipalities because the lower number of
observations. And hence we limit ourselves to the 12 most important
Flemish cities where electronic voting was used. In those cities the
overall, conservative, estimate is almost 2, while the less conservative
estimate is 4.5.
I repeat the interpretation here: In the most
important Flemish cities that used electronic voting, the probability to
have a (much) higher votershare than expected on a
hotspot is almost twice as high as it is for a normal position. If we use the less conservative estimate it becomes 4.5.
Some parties are more affected than others. The right-wing
Vlaams Belang
party seems to be more affected than others. If we again limit the
analysis to the 12 most important Flemish cities that used electronic
voting we see that the probability that a
hotspot is an outlier
is 40%. This is 10 times higher than it is for other positions for this
party. If we use the less conservative estimate the ratio becomes more
than 80.
The heatmap below illustrates the situation for
Vlaams Belang
in the main Flemish cities well. The columns are the twelve major
cities in Flanders that used electronic voting. The rows are the
positions on the candidates-list. The blocks with a blue border are the
hotspots.
Notice that the total number of candidates on the list can vary over
the cities. The colouring of the heatmap is a function of the squared
residuals of the multilevel-model. We thus take a less binary approach
as we did above when we classified all cases as either being outliers or
not. The dark areas (red and orange) are the positions where the voter
share was close to the expectation. Lighter colours (yellow and white)
indicate positions that deviated from the expectation (higher or lower).
The
first thing we notice in the heatmap below is that the top position and
the last position are generally not well estimated by the regression
model. That's not ideal, but it is less relevant from a "Touch Screen
Effect" point of view (none of the top or bottom positions are on a
hotspot).
The important thing here is to notice that the remaining area between
the top and the last position generally is dark (red or orange). There
are some brighter spots, though. The brightest spots happen to be in the
blue rectangles, i.e.
hotspots, illustrating the effect of the
position of the partyname (on the previous screen) on the preference
votes themselves. It appears that besides Turnhout, the only cities that
were not affected are those where the party name was split over two
candidate columns (and hence two
hotspots for Genk, Aalst en Roeselare).
 Remark: for a figure of better quality see the original paperConclusions:
Based
on these findings I'm confident that the "Touch Screen Effect" as
reported by the newspapers right after the muncipal election in
Flanders, Belgium in 2012, were not only anecdotal, but had a clear
effect in Flanders's largest cities. The study remains inconclusive with
regard to smaller municpalities. On aggregate there remains a
noticeable effect over all municipalities were electronic voting was
used. Some cities, such as Antwerp, and some parties, such as Vlaams
Belang, seem to be more strongly affected than others.
From a data science perspective it is interesting to notice that in this reseach I had to combine 3 skills:
- Hacking skills to assemble all required data (scraping of the election results from a news website with Python).
- Statistical skills to model the data and detect outliers (multilevel regression models in R with the lme4 and LMERConvenienceFunctions packages).
- Substantive expertise in the political situation in Belgium to understand how the election process works.
It is not by accident that these are also the three elements in
The Data Science Venn Diagram of Drew Conway:
 Original article
 For the Android smartphone version, CloudOn also introduced a revamped
version of the Microsoft Office ribbon that makes it easier to use on a
touch-enabled device by spacing icons out a bit and making them larger
so that “functions like selecting font size, turning on track changes or
creating a table are dead simple for users across all editing options.”
For the Android smartphone version, CloudOn also introduced a revamped
version of the Microsoft Office ribbon that makes it easier to use on a
touch-enabled device by spacing icons out a bit and making them larger
so that “functions like selecting font size, turning on track changes or
creating a table are dead simple for users across all editing options.”
 The
answer is a work in progress. NASA, for one, admits to currently having
a big data problem. “(D)ata is continually streaming from spacecraft on
Earth and in space, faster than we can store, manage, and interpret
it,” writes NASA Project Manager
The
answer is a work in progress. NASA, for one, admits to currently having
a big data problem. “(D)ata is continually streaming from spacecraft on
Earth and in space, faster than we can store, manage, and interpret
it,” writes NASA Project Manager 


