Just before launching its latest general update to Google Hangouts, Google also recently announced that it is bringing its new group video chat tool to India.
Just like in other countries, Google is replacing its current
plugin-based Gmail video chat system with Hangouts in India, allowing
its users there to chat with up to 9 people at a time (or just have a
1:1 chat like before).
With today’s larger update, Google introduced a bandwidth slider that
allows users to switch of to adjust how much bandwidth they are using
for Hangout – something especially important in countries where
high-speed connections aren’t all that prevalent. Google also made an
audio-only made available with this update (other participants will just
see your avatar) and the service already offered an ultra-low bandwidth mode since last year.
Google first introduced Hangouts in Gmail in the middle of last year.
Here is the full announcement:
Over the last few months, we’ve been rolling out updates
to Google+ Hangouts to make it easy for you to connect with friends and
family no matter where you are. Today we’re excited to bring Hangouts to
all of our Gmail users in India.
You can continue to enjoy 1:1 video chat with any Gmail user, but now
you’ll be able to add up to 9 people at once after they’ve upgraded to
Google+. What’s more, with Hangouts you can watch YouTube videos with
friends, collaborate on Google Docs, or play games by adding apps from
the menu on the left. If you find yourself with a slow connection, just
switch over to ultra low bandwidth mode to keep the conversation going.
To give Hangouts a try, just click on the hangout button at the top
of your chat list in Gmail. You can also schedule a hangout with Google
Calendar, and use the Google+ app for Android and iOS to hang out while
you’re on the go.
Google loves everything that makes the web faster. Given that images typically account for more than half of a web page’s size, it has now been working on its own WebP image format
for a few years. Using WebP, Google says, results in images that are
significantly smaller than those encoded in the far more popular PNG
format. After introducing the new format in Chrome, Picasa and Gmail in
2011, Google today announced that it has also started using it in its Chrome Web Store.
The Chrome Web Store is obviously a good target for WebP, given that
its users are likely using Chrome. The only other browser that currently
supports the format is Opera. Google,
which is also clearly trying to get some support from developers and
other vendors with today’s blog post, says that WebP “offers
significantly better compression than these legacy formats (around 35 percent better
in most cases).” As for the Chrome Web Store itself, Google says that
converting the PNGs that it used to use for the large promotional images
in the store to WebP allowed it to reduce image sized by about 30
percent. Given the reach of the store, Google says, this “adds up to
several terabytes of savings every day.”
More importantly, this also brought the average page load time down
by nearly one-third, which is obviously what Google is really interested
in.
Besides talking about the Chrome Web Store, Google is obviously
hoping that developers will take a second look at WebP, which hasn’t
made a lot of waves so far. While quite a few image editors now support the format, the reality is that WebP barely registers on the web today. Instead, PNG is now the most popular image format on the web, followed by the venerable old Graphics Interchange Format (GIF).
Original Source :http://techcrunch.com/2013/02/07/google-now-uses-its-own-webp-format-instead-of-pngs-in-the-chrome-web-store/
Apple’s next big growth market could be India – a country where it
has failed to find significant purchase with consumers up until this
point. The Economic Times (via @ScepticGeek)
is reporting that sales of Apple devices, with iPhones leading the way,
rose by between 300 and 400 percent in the past quarter. That growth,
identified by research firm IDC, is likely being propelled by Apple’s
distribution partnerships with Redington and Ingram Micro.
According to Convergence Catalyst founder Jayanth Kolla in
conversation with the Economic Times, Apple’s strategy in India mirrors
the route it took to success in China; the company spent time studying
the market, learned what it needed to do to sell handsets in India and
then got aggressive about executing its sales strategy. Apple’s India
team grew by 500 percent in six months to help make that happen, going
from 30 to 150 people, Kolla says.
Apple’s strategy in India hasn’t involved fielding a lower cost
device, but it has included making its iPhone more attainable for
cost-conscious buyers. That’s being done through installment-based
payment schemes operated through its resale partners, including one with
TheMobileStore, a national Indian retail chain, which that company’s
CEO says has helped increase sales of Apple gadgets three-fold in the
past year.
Three- or four-fold growth in a single quarter is definitely
impressive, but Apple has to make up a considerable gulf in India.
According to recent figures from IDC,
Samsung had a 46 percent market share in India between July and
September 2012, and Apple didn’t even show up in the top five, with HTC
rounding out that crowd with a relatively small 6.6 percent. Browsing
stats show that Apple has only a tiny percentage of current mobile web traffic in the country, and the most recent IDC numbers for mobile operating systems show a meager 1.4 percent share of sales in the July through September 2012 quarter.
Last year, during an Apple quarterly conference call, CEO Tim Cook said
that while he “love[s]” India, he said they didn’t see much opportunity
there in the short-term and would be focusing on other market where
there was more growth potential for the time being. Part of the reason
for his hesitation was the distribution system in that country, he said
at the time. But a fresh injection of local Apple staff, and a
distribution model that is beginning to find its legs could signal that
Cook and Apple are finally willing to put in the time and effort to grow
their presence in India, where there is reportedly currently less than
10 percent smartphone penetration.
Original Source :http://techcrunch.com/2013/02/08/apples-iphone-sales-grow-by-as-much-as-400-in-3-months-in-india-but-theres-a-huge-gap-to-close/
Right after yesterday’s earnings, LinkedIn shares (NYSE:LNKD)
have popped 19.16 percent to 147.86. It is clearly linked to the
company’s earnings. Revenue is up 81 percent to $304 million and net
income is following the same trend.
Since going public, LinkedIn’s revenue has been steadily going up and
net income is finally catching up — compared to the previous quarter,
net income is up five times from $2.3 million to $11.5 million.
LinkedIn CEO Jeff Weiner even called 2012 a “transformative year” for
the company in a statement. LinkedIn passed 200 million members with
good international growth. The product received some improvements, such
as a redesign profile page, new API implementations and upgrades to the
mobile apps.
Overall, every metric indicates that the company is in a good shape.
Contrarily to other companies that were under the IPO spotlights in
2012, LinkedIn fared pretty well. Shares have been up around 200 percent
from 74.32 to 147.86 over the last 12 months. Facebook, Zynga and
Groupon had more troubles on this ground.
The company’s NYSE IPO dates back to May 2011. Priced at $45 a share,
the stock has more than tripled since that time. LinkedIn expects
growth to continue. 2013 should be another good year for the social
network.
O
Original Source :http://techcrunch.com/2013/02/08/linkedin-shares-soar-19-2-in-the-wake-of-impressive-earnings/
Google just added
the equivalent of an app store to Google Drive that lets you find
Drive-enabled third-party apps like HelloFax, SlideRocket and the Open
Office Document Reader right from within the service. Once installed,
these apps now also live right in the Google Drive ‘Create’ menu. Until
now, users had to go through the Chrome Web Store to find Drive-enabled third-party apps.
As Google’s Nicolas Garnier writes this morning, the Drive SDK
allows developers to offer users “an experience similar to how Google
Docs and Google Sheets interact with Drive.” Currently, there are about a
hundred web apps that use the Drive SDK to integrate with Google Drive.
This integration, for example, includes
the ability to open files in a third-party app directly from the Drive
UI and to start new documents from the Google Drive ‘Create’ menu, as
well as ways to export and convert Google Docs.
In this new iteration of Google Docs, these third-party apps also get
first billing in the ‘Create’ menu and a new “Connect Your Apps” button
at the bottom of the menu puts a stronger spotlight on this slowly
growing ecosystem of Drive-connected apps.
Developers who currently list their Drive-enabled apps in the Chrome
Web Store won’t have to do anything new. The information will
automatically be pulled into Google Drive collection.
O
Original Article :http://techcrunch.com/2013/02/08/google-integrates-third-party-web-apps-more-deeply-into-google-drive/
Kera, a Toronto-based startup set to revolutionize the software
product demo space with guided tutorials that are interactive and live
on a site, instead of in a static video, has just launched new subtitle and captioning features,
as well as basic analytics to help websites using its tech track user
participation. This iteration on the company’s platform adds
considerably to its existing appeal, which has already attracted some
good early traction for the young startup.
What Kera does is
take the boring, bland walkthrough video of old and turn it into a
step-by-step, interactive presentation laid on top of the product it’s
meant to be explaining itself. The model can be applied broadly to web
applications, which means you could easily set up a new employee with a
guided tour of your CMS or invoicing software, without having to hold
their hand, and with a tool that should be much more effective than a
static screencast, since it actively involves them in the learning
process and can require that a participant get a step right before
moving on to the next stage of training.
The potential of the product is obvious once you take it for a test
run. There’s instant feedback when something goes wrong, so bad behavior
is corrected immediately, and it has applications beyond training
employees, including making sure that visitors to your website don’t go
away disappointed, which can help improve conversion rates. And they’re
remarkably easy to set up.
The new subtitle-only option is a big step forward for Kera because
it simplifies things even further, by allowing companies to build
walkthroughs that don’t require any kind of audio or narration
component. Recording audio, especially if you want to actually do a good
job of it, is a time-consuming and often costly process. Now, users can
just stick with text to make things a lot easier. Kera Product
Marketing Manager Taige Zhang explained the benefits of the change in an
interview.
“Basically, for people who just want to make tutorials really
quickly, this is so amazingly fast because you don’t have to create an
audio file, which takes up most of the time, and make it into almost
like a story,” he said. “This is just to create something where you want
to demonstrate a concept really fast. [Our demo] took about five
minutes to create.” As one of Kera’s key value propositions is its ease
of use vs. other traditional screencasting and walkthrough tools, this
should be a big draw for potential customers.
Currently, Kera is gating customers through an application process, and has signed on the recently acquired BufferBox (bought by Google),
Parsely, Geckoboard and Boundary to name a few. The startup has closed
$500,000 in seed funding from Extreme Startups, BDC and other private
investors, and the Kera team is currently heads down on a big new
release coming up this spring. Kera emerged from free beta earlier in
February, when it began charging its first customers.
Kera has competitors, including Tel Aviv-based WalkMe,
but the market has a lot of potential for growth, and new plans
including walkthrough, which Kera just launched as an MVP, could help
the Toronto startup ramp up its appeal relative to others in the field. A
deciding factor in who comes out on top in this tutorial space is which
company does mobile best, both on the web and in native apps, so we’ll
have to see what’s next from these companies in that emerging field.
Original Article :http://techcrunch.com/2013/02/08/kera-adds-subtitle-option-and-analytics-to-its-guided-interactive-web-tool-tutorials/
Moody’s and Standard & Poor’s have just been charged with knowingly misrepresenting the credit risk
involved in some of the mortgage-backed securities they rated during
the run-up to the 2008 financial crisis. The agencies will resist,
saying that they simply erred in predicting the future, as anyone could
have.
But there were many who called the housing bubble correctly,
long before the collapse in 2008. Several economists had pointed out
that there was in fact an enormous housing bubble being created by
overheated home prices, and it became a matter of public concern long
before 2008. The term “housing bubble” appeared in just eight news
accounts during the year 2000, but during 2005 it appeared nearly 3500
times, with Google searches for the term growing nearly ten-fold from
2004 to 2005 alone.
“And
yet, the ratings agencies—whose job it is to measure risk in financial
markets—say that they missed it. It should tell you something that they
seem to think of this as their best line of defense. The problems with
their predictions ran very deep.” This is the indictment leveled by Nate
Silver, in his fresh and readable book The Signal and the Noise: Why So Many Predictions Fail - but Some Don't (Penguin, 2012). It is the subject of this week’s Friday Book Share.
It
remains to be seen whether the government will be able to prove its
case that the ratings agencies intentionally misled investors with
respect to the risks involved in mortgage-backed securities, but what
can’t be denied is that the risk of a meltdown was enormous, and it was
well known. So why were their predictions so terrible?
One
important issue, Silver suggests, is that the agencies were either
“unable or uninterested in appreciating the distinction between risk and
uncertainty.” Risk, he says, is something that can be calculated, so
you can put a price on it. You can price the risk of winning or losing
at poker or roulette. By contrast, uncertainty is “risk that is hard to
measure,” and your own best estimate could be off by a factor of 1000 or
more. According to Silver, “Risk greases the wheels of a free-market
economy; uncertainty grinds them to a halt. The alchemy that the ratings
agencies performed was to spin uncertainty into what looked and felt
like risk.”
Overall, the quality of predictions made by experts
has been abysmal. The predictions of economic experts, political
experts, and other commentators generally perform at about the rate of
random chance. In fact, the most widely cited experts’ predictions are
generally the least accurate. This is partly because you can generate
media demand for your prognostications if they entertaining,
controversial, or unusual – but these are not qualities usually
associated with accuracy.
Nate Silver is the statistician and pollster whose “FiveThirtyEight” blog for the New York Times called the 2012 Presidential election flawlessly, correctly predicting the outcomes
in all 50 states and the District of Columbia. He says one of the most
important problems that all pollsters have – indeed all researchers,
prognosticators, and pundits – is that they tend to predict things that
confirm their own hopes and biases. Moreover, it’s very difficult to
avoid having your predictions contaminated by your own subjective
opinions. “Pure objectivity,” he says, “is desirable but unattainable in
this world.” But pure objectivity is something he clearly aspires to,
and he suggests that you should, too, if you want to be able to predict
future events.
(Personal aside: I read The Signal and the Noise
prior to the election, while I was still eagerly anticipating a Romney
win, and my friends found it odd that I suddenly began suggesting glumly
that Romney probably wouldn’t win, after all. My revised opinion was
based on my purposeful adoption of some of the strategies Silver
suggests for maintaining one's objectivity.)
Silver’s book reviews
the accuracy of forecasting in a wide array of fields, from politics
and economics to sports, weather, and terrorist attacks. Economic
forecasting is still so bad, he says, that when it comes to forecasting
recessions “a majority of economists did not think we were in one when
the three most recent recessions, in 1990, 2001, and 2007, were later
determined to have begun.” And earthquakes are so difficult to predict
that we’re nowhere near a meaningful tool for doing so.
By
contrast, there has been a radical increase in the accuracy of weather
forecasting over just the last couple of decades. Today’s weather
forecasters can predict a hurricane’s landfall within 100 miles of
accuracy some 72 hours in advance, while as recently as 1985 this
wouldn’t have been possible until 24 hours beforehand. Nevertheless,
people’s biases are so strong that they will often ignore very good,
quantitatively accurate forecasts and predictions. A full five days in
advance of the Katrina disaster, the National Hurricane Center projected
a direct hit on New Orleans, and 48 hours in advance of its arrival
they predicted that a “nightmare scenario” might well arise when the
levees were breached. Even so, the political leaders in New Orleans
remained reluctant to act, delaying the call for evacuation until the
very last minute. The result was that 80,000 people (20% of the city’s
population) didn’t get out, and 2% of them (1600 folks) paid for this
with their lives.
One of the most important tools for improving
prediction is feedback. When meteorologists make daily predictions, they
get daily feedback, and the result is a dramatic improvement, aided by
computer tools. Business leaders, however, rarely get such immediate
feedback, so inaccurate predicting skills in business are rarely
improved. Biases intrude, subjectivity reigns, and no one goes back
later to see what was correctly foreseen and what was not.
And
while meteorologists’ predictive skills have greatly improved, the same
cannot be said of climatologists' effort to predict global warming,
because meaningful “feedback” about climate change
won’t be available for decades or more. Nevertheless, Silver spends
several pages evaluating the statistical predictions of the IPCC
(International Panel on Climate Change), and his conclusion is that,
while there can be little doubt that the atmosphere is likely to warm
gradually with increasing levels of CO2, the IPCC's own forecasts tend
to be more alarmist than necessary, and relative to other forecasts
"might deserve a low but not failing grade."
The massive
quantities of data now available, coupled with the computer processing
power to sift through it and subject it to microsopic analysis, can
easily give us a false sense of confidence. As op-ed columnist David
Brooks said recently, it is as if there is a new "religion" of "data-ism," leading some to think that "data
is a transparent and reliable lens that allows us to filter out
emotionalism and ideology; that data will help us do remarkable things —
like foretell the future." But data without common sense and intuitive,
human judgment can be dangerously misleading. Just ask the ratings
agencies.
According to Silver, “our predictions may be more
prone to failure in the era of Big Data. As there is an exponential
increase in the amount of available information, there is likewise an
exponential increase in the number of hypotheses to investigate. For
instance, the U.S. government now publishes data on about 45,000
economic statistics. If you want to test for relationships between all
combinations of two pairs of these statistics—is there a causal
relationship between the bank prime loan rate and the unemployment rate
in Alabama?—that gives you literally one billion hypotheses to test.”
And
with a billion hypotheses to work with, it isn’t at all difficult to
find a few million spurious correlations. In fact, I just wrote about
one such spurious correlation earlier this week, when I discussed the Super Bowl Stock Market Indicator (and if you want to see a few human biases up close and personal, just read a few of the irate comments by football fans!).
Original Source : http://www.linkedin.com/today/post/article/20130208132421-17102372-how-to-predict-the-future-and-how-not-to
Nat Friedman is CEO and co-founder of Xamarin
Apple’s App Store review process is designed to keep the app
ecosystem healthy and to protect users from low-quality or hostile apps.
And the system mostly works. But sometimes an app is rejected for
reasons you might not expect, and it can force developers to scramble to
either push back launch dates or even have to redevelop key features.
Before you head down that road, here are nine surprising reasons apps
get rejected by the App Store that you should consider before you
submit your next app: 1. Use of the word “beta” or otherwise indicating that your app is unfinished
Google has made it a standard industry practice to launch services
into indefinite “beta,” but Apple can be quite strict about any
indication that an app is unfinished or not yet ready for prime time. We
have seen apps get rejected for being labeled “Beta,” “Preview,” and
even “Version 0.9.” 2. Long load time
All mobile operating systems – iOS, Android, and even Windows –
enforce a maximum app startup time. For iOS, the limit is about 15
seconds, and if your app isn’t running by then the operating system will
kill it.
But even if your app loads within the limits during your local
testing, slower network connections, slower hardware, and other
differences in the environment may cause your app to start too slowly
during the review process. So don’t rely on the iOS simulator alone – be
sure to test on actual hardware, and keep a few older phones around to
ensure all users have a snappy startup.
Remember, your app’s load time is your first chance to impress your users. 3. Linking to outside payment schemes
Apple requires that all digital content be sold through the built-in
iTunes-based in-app purchasing mechanism. This applies to one-time
purchases as well as digital subscriptions. If your app accepts other
payment mechanisms for digital content, you can be sure it will be
rejected. This is the reason the Kindle app does not allow users to
purchase new books.
One important subtlety is that this rule applies even to Web pages
linked to from your app. The Dropbox app was famously rejected by Apple
because the Web-based login screen contained a link to purchase
additional space. This not only affected the Dropbox app, but all apps
that used the Dropbox SDK as well!
So double check your workflow to ensure that all purchasing goes
through the user’s iTunes account, or is removed altogether. This rule
does not apply to non-digital services or merchandise, which is why
Apply doesn’t get a cut of your Uber rides or hotel rooms booked through
an app. 4. Do not mention other supported platforms
This rule is not unique to Apple – none of the curated app
marketplaces like it when apps mention rival platforms by name. So if
your app is also available on Windows or Android, advertise that on your
Web site, not in the app or the app store description. 5. Localization glitches
The users of your mobile app will be everywhere, not just in the city or country the development was done.
Even if you haven’t localized your app for multiple languages, it
will look amateur if 300 YEN comes out looking like $300.00 for in-app
purchases. Use add-ons such asNSNumberFormatter or Invariant Culture and
a simulator to test the user experience in different locales to make
sure dates and other data conform to the user’s location.
For instance, we’ve seen European apps fail to handle negative values
for latitude and longitude, and therefore not pass review in Cupertino,
which is at Longitude -122.03. Make sure your app works at all points
on the map, and especially check that your lat/long math for groups of
points span the positive/negative boundaries of the prime meridian and
the equator. 6. Improper use of storage and filesystems
Soon after iOS 5.1 was released, Apple rejected an app update because
developers had unpacked the 2MB database from the app bundle into the
filesystem, violating the iCloud ideal of backing up only user-generated
content.
Any data that can be re-generated because it is static, shipped with
the application or is easily re-downloaded from a remote server, should
not be able to be backed up. For non-user data, choose a cache storage
location or mark with a “do not backup” attribute. 7. Crashes from users denying permissions
In iOS 6 users must give permission for apps to access the address
book, photo gallery, location, calendar, reminders, Bluetooth, Twitter
and Facebook accounts. If the user chooses to deny an app access to any
of these services, Apple requires that the app continue to function
anyway.
This will certainly be tested during validation and will be an
automatic rejection if it fails to work properly. You should test all
combinations of “allow” and “deny” for all the data your app uses,
including if the user allows access but later denies it in Settings. 8. Improper use of icons and buttons
Many an iOS app have been rejected because of small UI issues that
had nothing to do with performance or functionality. Make sure the
built-in Apple icons and buttons are uniform in appearance and
functionality by using a standard UIButtonBarSystemItem and familiarize yourself with Apple’s Human Interface Guidelines.
For instance, you don’t want to use the “compose” icon for anything
other than referring to content creation. Apple engineers want apps to
behave in predictable ways and are therefore understandably strict about
this. 9. Misuse of trademarks and logos
Don’t use trademarked material or Apple icons or logos anywhere in
your app or product images. This includes using icons that feature a
drawing of an iPhone! We’ve also seen apps get denied for having
trademarks in the keywords of the app.
The flipside of this is that you should be sure your app does not
obscure the attribution information in any embedded maps – this is also
an automatic rejection.
. . .
. . .
If your app does get rejected, don’t panic — address the issue and resubmit. In an emergency, Apple provides an expedited review process which
can be used for critical bug fixes or to address security issues. But
be careful. Developers who overuse the expedited review will be barred
from using it in the future.
The best approach is to avoid rejection in the first place. So, study the submission guidelines and focus on building a high-quality app. Your users will thank you for it. Nat Friedman is CEO and co-founder of Xamarin, a cross-platform
mobile development framework for building native mobile apps in C#,
while sharing code across iOS, Android, Mac, and Windows apps. Nat’s
guidance is based on the experiences of more than 220,000 Xamarin
developers.
We’re more fooled by noise than ever before, and it’s because of a
nasty phenomenon called “big data.” With big data, researchers have
brought cherry-picking to an industrial level.
Modernity provides too many variables, but too little data per
variable. So the spurious relationships grow much, much faster than real
information.
In other words: Big data may mean more information, but it also means more false information.
Just like bankers who own a free option — where they make the profits
and transfer losses to others – researchers have the ability to pick
whatever statistics confirm their beliefs (or show good results) … and
then ditch the rest.
Big-data researchers have the option to stop doing their research
once they have the right result. In options language: The researcher
gets the “upside” and truth gets the “downside.” It makes him
antifragile, that is, capable of benefiting from complexity and
uncertainty — and at the expense of others.
But beyond that, big data means anyone can find fake statistical
relationships, since the spurious rises to the surface. This is because
in large data sets, large deviations are vastly more attributable to
variance (or noise) than to information (or signal). It’s a property of
sampling: In real life there is no cherry-picking, but on the
researcher’s computer, there is. Large deviations are likely to be
bogus.
We used to have protections in place for this kind of thing, but big
data makes spurious claims even more tempting. And fewer and fewer
papers today have results that replicate: Not only is it hard to get
funding for repeat studies, but this kind of research doesn’t make
anyone a hero. Despite claims to advance knowledge, you can hardly trust
statistically oriented sciences or empirical studies these days.
This is not all bad news though: If such studies cannot be used to
confirm, they can be effectively used to debunk — to tell us what’s
wrong with a theory, not whether a theory is right.
Another issue with big data is the distinction between real life and
libraries. Because of excess data as compared to real signals, someone
looking at history from the vantage point of a library will necessarily
find many more spurious relationships than one who sees matters in the
making; he will be duped by more epiphenomena.
Even experiments can be marred with bias, especially when researchers
hide failed attempts or formulate a hypothesis after the results — thus
fitting the hypothesis to the experiment (though the bias is smaller
there).
This
is the tragedy of big data: The more variables, the more correlations
that can show significance. Falsity also grows faster than information;
it is nonlinear (convex) with respect to data (this convexity in fact
resembles that of a financial option payoff). Noise is antifragile. Source: N.N. Taleb
The problem with big data, in fact, is not unlike the problem with
observational studies in medical research. In observational studies,
statistical relationships are examined on the researcher’s computer. In
double-blind cohort experiments, however, information is extracted in a
way that mimics real life. The former produces all manner of results
that tend to be spurious (as last computed by John Ioannidis) more than eight times out of 10.
Yet these observational studies get reported in the media and in some
scientific journals. (Thankfully, they’re not accepted by the Food and
Drug Administration). Stan Young, an activist against spurious
statistics, and I found a genetics-based study claiming significance from statistical data even in the reputable New England Journal of Medicine — where the results, according to us, were no better than random.
And speaking of genetics, why haven’t we found much of significance
in the dozen or so years since we’ve decoded the human genome?
Well, if I generate (by simulation) a set of 200 variables —
completely random and totally unrelated to each other — with about 1,000
data points for each, then it would be near impossible not to
find in it a certain number of “significant” correlations of sorts. But
these correlations would be entirely spurious. And while there are
techniques to control the cherry-picking (such as the Bonferroni
adjustment), they don’t catch the culprits — much as regulation didn’t
stop insiders from gaming the system. You can’t really police
researchers, particularly when they are free agents toying with the
large data available on the web.
I am not saying here that there is no information in big data. There
is plenty of information. The problem — the central issue — is that the
needle comes in an increasingly larger haystack.
Original Source :http://www.wired.com/opinion/2013/02/big-data-means-big-errors-people/
In my article, “Data Integration Roadmap to Support Big Data and Analytics,”
I detailed a five step process to transition traditional ETL
infrastructure to support the future demands on data integration
services. It is always helpful if we have an insight into the end state
for any journey. More so for the data integration work that is
constantly challenged to hit the ground running.
There are two
major architectural changes that are shaking the traditional integration
platforms warranting a journey into the future state. First, the
ability and needs for organizations to store and use big data. Most of
the big data has always been available for a longtime, but only now
there are tools and techniques available to process it for the business
benefits. Second, the need for predictive analytics based on the history
or patterns of past or hypothetical data driven models. While the
business intelligence deals with what has happened, business analytics
deal with what is expected to happen. The statistical methods and tools
that predict the process outputs in the manufacturing industry have been
there for several decades, but only recently they are being
experimented with the organizational data assets for a potential to do a
much broader application of predictive analytics.
The diagram
below depicts the most common end state for the data integration
ecosystem. There are six major components in this system. Sources – the
first component is the set of the sources for structured or
unstructured data. With the addition of cloud hosted systems and the
mobile infrastructure, the size, velocity and complexity of the
traditional datasets began to multiply significantly. This trend is
likely continue and computer sciences corporation predicated that data production will be 44 times more in 2020 when compared with the corresponding in 2009.
With this level of growth, data sources and their sheer volume forms
the main component of the new data integration ecosystem. Data
integration architecture should enable multiple strategies to access or
store this diverse, volatile and exploding amount of data. Big Data Storage – while
the big data storage systems like Hadoop provide good means to store
and organize large volumes of data, presently, processing it to extract
the snippets of useful information is hard and tedious. Map/Reduce
architecture of these systems gave ability to quickly store large
amounts of data and opened up doors to many new data analytics
opportunities. The data integration platform needs to build the
structure for big data storage and map out its touch points with the
other enterprise data assets. Data Discovery Platform – the
data discovery platform is a set of tools and techniques that work on
the big data file system to find patterns and answers to questions
business may have. Presently, it is mostly an Adhoc work and
organizations still have difficulty putting a process around it. Most
people compare the data discovery activity with the gold mining. Only
that in this case, by the time one completes mining gold, the silver
becomes more valuable. In other words, what is considered valuable
information now may be history and unusable only a few hours later. The
data integration architecture should encompass this quick and fast paced
data crunching enforcing the data quality and the governance. As I
detailed in my article, “Data Analytics Evolution at LinkedIn - Key Takeaways,”
strategies such as LinkedIn’s “three second rule,” can drive the data
integration infrastructure to be very responsive to meet the end user
adaptation needs. According to LinkedIn, the repeated Adhoc requests are
systemically met by developing data discovery platform that has a very
high degree of reusability of the lessons learned. Enterprise Data Warehouse – the
traditional data warehouses will continue to support the core
information needs, but will have to encompass the new features to
integrate better with the unstructured data sources and also the
performance demands of the analytics platforms. Organizations have begun
to develop new approaches to isolate the operational analytics from
deep analytics on the history for strategic decisions. The data
integration platform should be versatile to isolate the operation
information from the strategic longer-term data assets. Also the data
integration infrastructure needs to be more temperamental to enable
quick access to most widely and frequently accessed data. Business Intelligence Portfolio – the
business intelligence portfolio will continue to focus on the past
performance / results even though there would be increased demands for
operational reporting and performance. The evolving needs of
self-service BI and mobile BI will continue to post architectural
challenges to the data integration platforms. One other critical aspect
would be BI portfolio’s ability to integrate with the data analytics
portfolio. This need may further increase the demands on enterprise
information integration. Data Analytics Portfolio – there
is a reason why they call people working with data analytics as data
scientists. Analytical work that goes on within this portfolio need to
deal with business as well as data problems and the data scientists need
to work their way through building the predictive models that add value
to the organization. Data integration platform plays two roles to
support the analytics portfolio. First, data integration ecosystem
should enable access to structured or unstructured data for analytics.
Second, enable re-usability of the past analytics activity to make the
field more of an engineering activity than science by reducing the
scenarios requiring reinventing the wheel.
In summary, data
integration ecosystem of the future will encompass processing very large
volumes of data and would deal with very diverse demands to work with
many varieties of sources of data as well as the end user base.
Original Article : http://smartdatacollective.com/raju-bodapati/103326/data-integration-ecosystem-big-data-and-analytics
MicroStrategy CEO Michael Saylor has a keen sense of where things
are headed. He sees mobile and social as the two drivers of a world
based largely in software. Last year I covered the announcements at the
MicroStrategy events in Amsterdam and the vision Saylor put forth in
his keynote speech. MicroStategy World 2013 last month finds the company
delving into such diverse areas as identity management, marketing
services and integrated point-of-sale applications. The uniting factor
is mobile intelligence.
At the event, MicroStrategy highlighted three innovative product lines. Usher,
announced in 2012, is a mobile identity management system that allows
you to issue digital credentials on a mobile device. Alert provides a
mobile shopper experience, including promotions, product locator,
transaction capabilities and receipt delivery. Wisdom, winner of the
2012 Ventana Research Technology Innovation Award for Social Media,
mines social media data from Facebook to help drive brand insight. Along
with large investments in cloud and mobile intelligence, these
technologies illustrate where the company is headed.
In a breakout
session provokingly titled “Beat Amazon and Google with Revolutionary
Retail Apps for Your Store Operations,” MicroStrategy Vice President of
Retail Frank Andryauskas brought the company’s technologies to life by
outlining a typical in-store mobile purchase process. A customer may
start by using Alert to engage social media while he looks at items on
his phone or tablet and checks prices, sizes or availability within the
application. Based on his selection, he may want recommendations through
Wisdom for items that his friends like or that appeal to them because
of their unique preferences. He could choose to purchase an item with a
coupon promotion delivered through Alert, or have the item drop-shipped
to his home or to the store.
On the back end, marketers can run
purchase path analytics that tie the customer experience to the
transaction. This in turn helps with promotional strategies that can
influence purchase behavior at the store level. The key for the
retailer, as well as for MicroStrategy, is to create customer value
through an in-store and online experience that is differentiated from
ones in other stores. The tools help retailers move beyond “showrooming”
and leverage their physical assets to drive competitive advantage.
The
MicroStrategy mobile retail vision gets even more compelling when you
look at what’s going on with their customers, including large retailers
that are using analytics to drive things such as employee engagement in a
brick-and-mortar retail environment, which in turn can improve customer
retention and increase share of wallet. The Container Store
demonstrated how it uses MicroStrategy mobile BI to allow employees to
view their performance as compared to their peers. This taps into a
fundamental human need to be on the leading part of a curve and never
lag behind. Friendly competition between stores with similar footprints
and trade areas can drive best-in-class store performance. It will be
interesting to see whether MicroStrategy can leverage this game approach
across other industries, such as travel and tourism, government,
manufacturing and healthcare. MicroStrategy has a strong presence and compelling use cases in the pharmaceuticals industry, with solutions around mobile
sales force enablement where operating smatrtphones and tables is a
priority today. This area can show tremendous productivity gains, as
in-meeting effectiveness often requires fast and easy access to pricing,
distribution and benchmark data. The ability to communicate with other
team members in real time during the sales process and to conduct
transactions on the spot can reduce sales cycle times. Ancillary
benefits include providing an audit trail of the best sales processes
and representatives, so that, much like in the retail environment,
pharmaceutical companies can develop and replicate a best-in-class
approach.
While the company’s long-range vision is solid,
MicroStrategy may be too far ahead of the curve. I would argue that the
company is on the leading edge of mobile and may have spent more money
than it had to in order to catch the mobile wave but is more ready than
any other BI provider. With technologies such as Wisdom, Alert and
Usher, it may be in a position similar to the one it was in a few years
ago with mobile. Wisdom uses “like” data from Facebook to drive
analytics, but how far can that data really get a marketer today? This
innovation needs to pay more dividends for marketers, and it might in
the future as Facebook starts to introduce a categorical verb universe
that denotes specific attitudes and purchase intent. Alert could be good
for a mid-market retailer, if its value and ease of use is compelling
enough for mobile users to download the application and sign up as a
store customer. Usher is spot on with its intent to manage digital
identity, but uptake may be slow since separating data about the user
from data about the phone is challenging. In sum, MicroStrategy is pressing its advantage in mobile
intelligence solutions and is figuring out ways to drive that advantage
into the mobile applications market. It is investing heavily in
enterprise business intelligence applications in the cloud, where it
already has more than 40 customers. It has an industry-leading business
intelligence toolkit and was ranked as a hot vendor in our 2012 Business Intelligence Value Index.
MicroStrategy
has a lot going for it, but it is also placing a broad set of
innovation bets relative to its size. In a recent interview, Saylor
said, “If these things play out the way I expect, then we’re a $10
billion revenue company, out 10 years. If they don’t play out the way I
expect, then whatever. We’ll muddle along and we’ll do what we’re going
to do.” I’m inclined to agree.
I watched a great video the other day by a colleague of mine, David Court.
You can see it below, but he nicely crystallizes the three things we
continually hear from our clients about what it takes to make big data
drive above-market growth.
1. Data – be creative when it comes to using internal and external data
2. Models – focus on developing models that predict and optimize
3. People – transform the organization with simple tools and effective training so that managers can take advantage of Big Data's insights.
I was particularly taken with his view of the short-term and medium-term issues when it comes your people. The short-term issues are around training and changing habits on the front lines so they can make use of Big Data insights. But the medium-term issues are around recruiting the right talent – marketing analysts, for example – and also creating systems and processes that deliver simple actions based on complex Big Data. That’s a great framework for considering how to fund your organizational changes, and balancing investment between the short- and medium-terms.
What examples have you seen of companies getting Big Data right?
Original Source :http://www.linkedin.com/today/post/article/20130207103409-1816165-the-big-three-of-big-data-what-to-do
Meet Jane.
Jane graduated college six months ago. She worked three internships
while in school, graduated with honors, and has sent her resume to
hundreds of companies. But, Jane is unemployed.
Meet Bob.
Bob also graduated college six months ago, no honors. Bob didn’t work
at any internships while in school and has never applied for a job, yet
Bob is employed. One day while he was playing basketball in a local
gym, the president of one of America’s largest auto manufacturers sees
Bob. The president has a company team and wants Bob to play on it so he
can win a championship. He hires Bob immediately (true story).
Every last one of us knows someone who always seems to have the most
incredible luck when it comes to locating and making the best of
opportunities that come along. We’ve all also spent quite a bit of time
wondering what his or her secret is and wishing we could bottle it to
use to our own advantage. This is especially the case when it comes to
landing a job in today’s economy.
While Bob is an uncommon scenario, there are plenty of people whose
paths seem to be effortless when it comes to getting the best
opportunities. And although you may wonder what the person’s secret is,
the truth is that there’s really no secret to be bottled. The person is
simply someone who naturally develops good habits in regards to job seeking. You can do the same by making sure you incorporate the following four habits into your own strategy: 1. Be Proactive
Successful job seekers aren’t successful because more opportunities
fall into their lap. They’re successful because they make it a point to
get out there and find chances to make things happen. They’re also
ever-prepared for the next good thing to come along. For instance, their
online professional profiles, personal websites, and resumes are kept
perpetually updated. Their wallets are always full of business cards
just in case they run into someone to give them to while out and about
(you get the idea). 2. Be Outgoing
Successful job seekers never turn down an opportunity to network or
rub elbows with other people in their field. Instead of sitting at home
in front of the television, they’re accepting those invites to corporate
get-togethers and attending local events where great contacts are
likely to be found. They’re also outgoing once they get there, making it
a point to introduce themselves to people and engage potential business
contacts. 3. Be a Team Player
Whether you’re working in a highly social environment or working
remotely with clients and customers who live overseas, it’s important
not to underestimate the value of people skills and the ability to
connect when it comes to those you work with. No one wants to hire
someone who doesn’t work well with others or who’s going to have too
much trouble being engaging and pleasant when they have to. Successful
job seekers take advantage of opportunities to get to know new people or
to contribute something to the team. 4. Step Out of your Comfort Zones
On some level, just about every one of us would prefer to play it
safe and be comfortable than take risks and step out a little. However,
those who are successful at what they do take the bull by the horns
instead and find ways to welcome new experiences as new adventures. They
welcome chances to try new things, meet new people, work on different
projects, and pick up new skills. They realize that every time they do,
they grow as people and have even more to offer than they did the day,
week, or month before. The more varied and experienced you can become in
regards to different things related to your field, the more attractive
you’re ultimately going to be as a job candidate.
Original Source :http://www.recruiter.com/i/4-habits-of-highly-successful-job-seekers/
In all the speculation that preceded Microsoft’s recent release of Office 2013,
one of the most hotly debated rumors was that Microsoft would be
announcing a version of Office for the iPad. Even with the debut of Microsoft’s Surface tablet, analysts said Microsoft couldn’t possibly afford to ignore the massive iOS user base.
They were wrong.
When asked point blank by Bloomberg Businessweek,
Microsoft CEO Steve Ballmer gave a terse answer to the question of when
we can expect an iPad version for Office: “I have nothing to say on
that topic. … We do have a way for people always to get to Office through the browser, which is very important.”
Clearly, Steve Ballmer has never tried taking his own advice. While InfoWorld notes that the cloud-based version of Microsoft Office is somewhat improved, it’s still not a really workable solution for iPad users.
The most obvious limitation of Ballmer’s workaround is the lack of
off-line access. If you need to work on one of your documents while
you’re without Internet access, well, tough.
And if you want to print, well, there’s a “workaround” for that, too.
You’ll have to basically “print” your document to a PDF and then print
the PDF.
(Meanwhile, Android users like me are just plain out of luck on all
counts, since the web apps are basically unusable on the Chrome
browser.)
All in all, it looks like Microsoft Office may be going the way of the dinosaur. By going all protectionist on non-Surface tablet users, Microsoft has tied itself to the shrinking PC market and is headed for irrelevance.
Users who need a better workaround than the one Steve Ballmer has
offered would be wise to check out better products offered by other
companies, including the popular (and still free) CloudOn app .
Original Source :http://lawyerist.com/microsoft-says-no-office-ipad/
Social media is still in its infancy, and many business executives
still don't understand how to Ieverage it for their organizations, large
or small. They're too focused on the talking, and not focused enough on
the listening.When I speak, I often begin by asking my audience,
"How many of you know at least one executive who doesn't fully
understand the business value of Twitter?"
Sure enough, the entire audience raises their hands. Then I tell them about my experience in Las Vegas three years ago.
I
had been standing in line to check in at Las Vegas’s then-trendiest
hotel in town, the Aria, for nearly an hour. I was exhausted and
frustrated after a 6 hour flight from New York, and just wanted to get
to my room and rest. The last thing I wanted to do was waste an hour of
my life waiting in line.
Frustrated, I did what any social media nerd would do - I pulled out my phone, and tweeted the following:
“No Vegas hotel could be worth this long wait. Over an hour to checkin at the Aria. #fail"
Unfortunately,
the Aria wasn't listening, and didn’t tweet back to me. But a
competitor was listening. Just two minutes later, I received a tweet
from the Rio Hotel down the street.
Now at this point, if you’re
anything like most executives I’ve shared this story with, you’re
thinking, “What did the Rio tweet - “Come on over, we have no line here"
or "Call us, we have a room for you!"?
Had the Rio tweeted
something like that to me, I would have thought two things: First, "Why
are you stalking me?" and second, "Why is it wide open at the Rio when
it's jam-packed and happening at the Aria?"
On the contrary, the Rio Las Vegas tweeted the following to me: “Sorry about your bad experience, Dave. Hope the rest of your stay in Vegas goes well.”
Guess where I ended up staying the next time I went to Las Vegas?
The
Rio hotel earned a $600 sale on the basis of that one tweet. But the
story gets even better, http://www.blogger.com/blogger.g?blogID=8937198211974413758#editor/target=post;postID=574992143176918759because I gave the Rio a "Like" on Facebook, and
a few months later, I got a message from a friend on Facebook. My
friend Erin asked, "Hey, I'm having a family reunion in Vegas this New
Year's, and I saw you liked the Rio's page. Do you recomend them?"
I
wrote back to her, "Well, the Rio isn't the newest hotel in Vegas, or
the nicest - but I'll tell you one thing - they know how to listen to
customers." She booked the Rio for 20 guests that day. One tweet from the Rio, and one "like" from me led to over $10,000 in revenue for the company.
No
executive that's heard or read this story could argue that the Rio's
message was a marketing or sales message, eiither. All they did was use
social media to listen, and then show a little empathy to the right
person at the right time. An ad, or a push-marketing-like message from
the Rio, simply wouldn’t have worked. But their ability to listen,
respond and be empathic did work.
The Rio was listening on Twitter
by tracking keywords of their competitors, and of the word "Vegas". If
you work at a hotel, you can do the same. If you work at a law firm, try
listening by doing a Twitter search for the words "need a lawyer". Or
if you work for a recruitment firm, try a search for the words "We're
hiring." Whatever your organization does, you can find
your customers and prospects on Twitter, Facebook, blogs, and everywhere
on the social web, by listening for the right words. The one thing every business executive must understand about social media: The secret to social media success isn't in talking - it's in listening.
Original Source :http://www.linkedin.com/today/post/article/20130207152835-15077789-the-1-thing-every-business-executive-must-understand-about-social-media
Stamford, CT-based analyst and market research firm Gartner released its annual data warehouse Magic Quadrant report Monday.
On the one hand, data warehousing (DW) and Big Data can be seen as
different worlds. But there's an encroachment of SQL in the Hadoop
world, and Massively Parallel Processing (MPP) data warehouse appliances
can now take on serious Big Data workloads. Add to that the number of
DW products that can integrate with Hadoop, and it's getting harder and
harder to talk about DW without the discussing Big Data as well. So, the release of the Gartner data warehouse report is germane to the Big Data scene overall and some analysis of it here seems sensible. The horse raceFirst,
allow me to answer the burning question: who "won?" Or put another way,
which vendor had, in Gartner's inimitable vernacular, the greatest
"ability to execute" and "completeness of vision?" The answer: Teradata.
Simply put, the company's 3-decade history; the great number of
industry verticals with which it has experience; the number and
diversity of its customers (in terms of revenue and geography); and the
contribution of the Aster Data acquisition to product diversity really impressed Gartner. Image credit: GartnerBut Teradata came out on top last
year as well, and its price points mean it's not the DW solution for
everyone (in fact, Gartner mentions cost as a concern overall for
Teradata). So it's important to consider what else the report had to
say. I won't rehash the report
itself, as you can click the link above and read it for yourself, but I
will endeavor to point out some overall trends in the report and those
in the market that the report points out.
Logical data warehouseIf there is any megatrend
in the DW Magic Quadrant (MQ) report, it's the emergence of the logical
data warehouse. Essentially, this concept refers to the federation of
various physical DW assets into one logical whole, but there are a few
distinct vectors here. Logical data warehouse functionality can allude
to load balancing, disbursed data (wherein different data is stored in
disparte physical data warehouses and data marts, but are bundled into a
logically unified virtual DW), and multiple workloads (where
relational/structured, NoSQL/semi-structured and unstructured data are
integrated logically). This multiple workload vector is a
Big Data integration point too, with 10 of the 14 vendors in the report
offering Hadoop connectors for their DW products. In-memory is hot In-memory technology, be it
column store-based, row store-based, or both, and whether used
exclusively or in a hybrid configuration with disk-base storage, is
prevalent in the DW space now. Gartner sees this as a competitive
necessity, and gives IBM demerits for being behind the in-memory curve.
On the other hand, it refers three times to the "hype" surrounding
in-memory technology, and generally attributes the hype to SAP's
marketing of HANA. Meanwhile,
Gartner notes that HANA's customer base doubled from about 500 customers
at the end of June 2012 to 1,000 at the end of the year.
Support for R Support for the open source R
programming language seems to be accelerating in mainstream DW
acceptance and recognition. Support for the language, used for
statistics and analytics applications, is provided by 2013 DW MQ vendors
Exasol, Oracle and SAP. Oracle offers a data connector for R, whereas
Exasol and SAP integrate R into their programming and query frameworks.
I think it's likely we'll see adoption of R gain even more momentum in 2013, in the DW, Business Intelligence and Hadoop arenas.
Several players with customer counts at 300 or lessNot
everything in the Gartner DW MQ report focuses on big, mainstream
forces. Alongside mega-vendors like IBM, Oracle, SAP and Microsoft, or
veteran DW-focused vendors like Teradata, the report includes several
vendors with relatively small customer counts. The report says that 1010Data has "over 250" customers and Infobright "claims to have 300 customers." And those numbers are on the high side of small with Actian (formerly Ingres) weiging in at "over 65" customers, ParAccel claiming "over 60," Calpont at "about 50 named customers" and the report explaining that Exasol "reports 38 customers in production and expects to have 50 customers by January 2013." I'm not saying this to be snarky, but this is an important
reality check. Many of us in the press/blogger/analyst community,
myself included, somtimes assign big-vendor-gravitas to companies that
actually have very few customers. Sometimes the tail wags the dog in
this startup-laden industry, and readers should be aware of this.
That said, while ParAccel only claims "over 60" customers, one of its
investors is Amazon, which licensed ParAccel's technology for its new Redshift cloud-based data warehouse service.
Multiple "form factors"Another trend
pointed out by Gartner is the vareity of deployment/procurement
configurations (or -- to use Gartner's term -- "form factors") that DW
products are available in. The options offered by vendors include straight software licenses, reference architectures, appliances, Platform as a Service (PaaS) cloud offerings, and full-blown managed
services, where vendors provision, monitor and administer the DW
infrastructure. And, in the case of non-cloud options, vendors may base
their pricing on number of servers, processor cores or units of data
(typically terabytes). Sometimes they even let customers decide which
model works best. Many vendors offer several of these form factor and licensing
options, and Gartner implies that the more such options a vendor offers,
the better. Those that offer only one option may disqualify themselves
from consideration by customers. Those that offer several, and
especially those that allow customers the agility to move between
deployment and pricing models, tend to score higher in customer
satisfaction. Data modelsSpeaking of models, Gartner
makes special mention that HP and Oracle offer industry-specific DW data
models and that Microsoft, through certain partners, does as well.
Gartner sees this as an important feature in vendors' data warehouse
offerings. I would agree...data models can quickly convey best
practices and serve, at the very least, as useful points of departure
for accelerating DW implementations. HCatalog for matadata management HCatalog, originally introduced by Yahoo/Hortonworks
and now an Apache incubator project in its own right, acts as a
metadata repository designed to unify storage and data management for
Hadoop stack components like Hive, Pig and
the Hadoop MapReduce engine itself. On the DW side of the
world, ParAccel and Teradata are each integrating with HCatalog as a way
to integrate Hadoop data into the DW design, rather than merely
connecting to and importing that data. This would seem to indicate good
traction for HCatalog, and perhaps we will see such support spread more
ubiquitously next year. Microsoft on the upswingI
think it's important to point out Gartner's coverage of Microsoft in
this year's DW MQ report. Microsoft was in the Leaders Quadrant last
year, but at its very lower-left corner, whereas this year it's smack in
the center of that quadrant. Last year, the Redmond-based software
giant led with its Fast Track data warehouse, based on its SQL Server Enterprise product. Its MPP data warehouse appliance, SQL Server Parallel Data Warehouse (PDW) had little momentum, and few customers. I once served on Microsoft's Business Intelligence Partner
Advisory Council, and was initially unimpressed with the PDW product.
It struck me at the time as a product created to give Microsoft
credibility in the Enterprise-grade database game and provide peace of
mind for customers, and less of a product that was actually designed to
generate siginificant unit sales. But things have turned around. A year later, the product is up
to its third "appliance update" (and much better aligned with non-PDW
editions of SQL Server) and a bona fide version 2.0 of the product is
due later this year. Gartner says PDW has been adopted by 100 new
customers over the last 18 months, and is likely to accelerate further,
as Dell's PDW-based appliance gains momentum. Gartner also cites the xVelocity in-memory technology, present in PowerPivot, as well as the 2012 release of SQL Server Enterprise, and the tabular mode of SQL Server Analysis Services, as an important advance for the company, and even gives mention to StreamInsight, Microsoft's little known Complex Event Processing (CEP) engine.
The next version of PDW will include the new PolyBase component,
which integrates PDW's MPP engine with data nodes in the Hadoop
Distributed File System (HDFS) to provide true parallelized, non-batch,
SQL query capability over Hadoop data.
And the next major version of SQL Server Enterprise will include an in-memory transactional database engine, code-named Hekaton. Add to that the ability to license SQL Server outright, obtain DW reference architectures for it, buy various SQL Server-based appliances,
and to use SQL Server in the Amazon and Microsoft clouds (in
Infrastructure as a Service or PaaS configurations) and the product's
trajectory would seem to be upward. What's it all mean?No matter what you may think
of the merits of Gartner's influence in the technology market, there's
no denying that influence exists. The DW MQ report is extremely
important and seems especially methodical, well-thought out, and
insightful this year. Analysts Mark A. Beyer, Donald Feinberg, Roxane Edjlali and Merv Adrian have produced a report that everyone in the field should read.
Original Article :http://www.zdnet.com/gartner-releases-2013-data-warehouse-magic-quadrant-7000010796/
Oracle has defended the frequency of bug fixes for its popular open-source database MySQL, along with the information provided by the security-update process.
Tomas Ulin, vice president of MySQL engineering, said users are best
served by the degree of transparency and frequency of the database's
present critical-patch system.
"Our highest priority is to protect our users and customers and we
think that is best done by not providing exploits that are publicly
available," he said.
Ulin said customers can always ask for hot fixes for specific bugs if
they have specific concerns. "Yes, there might be some user out there
who is really eager to get a specific bug fix but in general the
community and the customers update very rarely. They don't want to touch
their working environment," he said.
MySQL follows the update policy that Oracle implements overall, Ulin
said, with bugs or Common Vulnerabilities and Exposures (CVE) numbers
and the release in which they are fixed announced four times a year on a
predefined date.
"That's publicly available and that's where we publicly announce
which bug fixes are tied to which release. You won't find that
[information] through release notes. But we've chosen to group it
together via the critical-patch update," he said.
MariaDB criticism
Criticism of Oracle's approach to MySQL security recently surfaced in a blog post on the website of MariaDB,
the rival community-developed branch of MySQL. Its author, Sergei
Golubchik, VP of architecture at MariaDB, said he was growing
increasingly concerned about the Oracle approach to MySQL security.
"And the fact that I was solely responsible for the
security@mysql.com for about 10 years, doesn't make it easier. On the
contrary, it only emphasises the changes in attitude," he wrote.
Among the criticisms, he lists a slower response to critical bug
fixes, very little information about security vulnerabilities, and
critical-patch updates "carefully stripped from anything that might help
to understand the problem, it takes hours to map them to code changes".
Planning upgrades
MySQL's Ulin said the present system enables database users to plan
upgrades. "You can go in and see the CVE number, the CVSS [Common
Vulnerability Scoring System] ratings and so on around a bug and make a
judgement call that this is something that requires me to update or
whether I should just wait for the next one," he said.
He said the three-monthly critical-patch updates continue to be an
effective approach. "That, we find, has been successful in the past and
successful moving forward as well," Ulin said.
"There have always been opinions out there that there should be some other way and I can't really comment on that," he added.
Original Article : http://www.zdnet.com/oracle-rebuffs-mysql-security-update-criticisms-7000010914/
The past year has been dominated by Big
Data. What it might mean and the way you might look at it. The stories
have often revolved around Hadoop and his herd of chums. Vendors and
analysts alike have run away and joined this ever-growing and rapidly
moving circus. And yet, as we saw in our own EMA and 9sight Big Data Survey,
businesses are on a somewhat different tour. Of course, they are
walking with the elephants, but many so-called Big Data projects have
more to do with more traditional data types, i.e. relationally
structured, but bigger or requiring faster access. And in these
instances, the need is for Big Analytics, rather than Big Data. The
value comes from what you do with it, not how big it happens to be.
Which brings us to Big Blue. I've been reading IBM's PureSystems announcement
today. The press release headline trumpets Big Data (as well as
Cloud), but the focus from a data aspect is on the deep analysis of
highly structured, relational information with a substantial upgrade of
the PureData for Analytics System, based on Netezza technology, first
announced less than four months ago. The emphasis on analytics,
relational data and the evolving technology is worth exploring.
Back
in September 2010, when IBM announced the acquisition of Netezza, there
was much speculation about how the Netezza products would be positioned
within IBM's data management and data warehousing portfolios that
included DB2 (in a number of varieties), TM1 and Informix. Would the
Netezza technology be merged into DB2? Would it continue as an
independent product? Would it, perhaps, die? I opined
that Netezza, with its hardware-based acceleration, was a good match
for IBM who understood the benefits of microcode and dedicated hardware
components for specific tasks, such as the field programmable gate array
(FPGA), used to minimize the bottleneck between disk and memory. It
seems I was right in that; not only has Netezza survived as an
independent platform, as the basis for the PureData System for
Analytics, but also being integrated behind DB2 for z/OS in the IBM DB2
Analytics Accelerator.
Today's announcement of the PureData
System for Analytics N2001 is, at heart, a performance and efficiency
upgrade to the original N1001 product, offering a 3x performance
improvement and 50% greater capacity for the same power consumption. The
improvements come from a move to smaller, higher capacity and faster
disk drives and faster FPGAs. With a fully loaded system capable of
handling a petabyte or more of user data (depending on compression ratio
achieved), we are clearly talking big data. The technology is purely
relational. And a customer example from the State University of New
York, Buffalo quotes a reduction in run time for complex analytics on
medical records from 27 hours to 12 minutes (the prior platform is not
named). So, this system, like competing Analytic Appliances from other
vendors, is fast. Perhaps we should be using images of cheetahs?
Want to make weather forecasting look good? Compare it to
predicting the economy. So concludes an ABC News Australia story by
finance reporter Sue Lannin, entitled "Economic forecasts no better than a random walk."
The story covers a recent apology by the International Monetary Fund
over its estimates for troubled European nations, and an admission by the Reserve Bank of Australia that its economic forecasts were wide of the mark.
An
internal study by the RBA found that 70% of its inflation forecasts
were close, but its economic growth forecasts were worse, and its
unemployment forecasts were no better than a random walk. (Recall the
random walk [or "no change" forecasting model] uses the last observed
value as the forecast for future values.) In other words, a bunch of
high-priced economists generated forecasts upon which government
policies were made, when they could have just ignored (or fired) the
economists and made the policies based on the most recent data.
Anyone
who has worked in (or paid any attention to) business forecasting will
not be surprised by these confessions. Naive forecasts like the random
walk or seasonal random walk can be surprisingly difficult to beat. And
simple models, like single exponential smoothing, can be even more
difficult to beat.
While we assume that our fancy models and
elaborate forecasting processes are making dramatic improvements in the
forecast, these improvements can be surprisingly small. And frequently,
due to use of inappropriate models or methods, and to "political"
pressures on forecasting process participants, our costly and time
consuming efforts just make the forecast worse.
The conclusion?
Everybody needs to do just what these RBA analysts did, and conduct
forecast value added analysis. Compare the effectiveness of your
forecasting efforts to a placebo -- the random walk forecast. If you
aren't doing any better than that, you have some apologizing to do.
We know that you’d like to see growth and improve your sales forecasting processes, and with the right CRM solution, you can.
Forecasting
is by no means a new tool that businesses use, but the digital
revolution means that the information that informs it and how it is
calculated can provide a much more accurate picture of what’s going to
convert down the line.
The Aberdeen Group’s 2012 ‘Better Sales Forecasting Through Process and Technology: No Crystal Ball Required’
report discovered that of the companies surveyed, the best-in-class
averaged 17.8% year-over-year revenue growth using sales forecasting
technologies, compared with 8.4% for industry average companies and just
0.2% at laggard companies.
Be Realistic
Does Your Sales Forecast Need Some Work? discusses
the results from a recent study, which found that sales teams are a tad
over-confident when it comes to their pipelines. More than 14,400
closed opportunities with sales cycles of 75 to 250 days were reviewed
over the course of five years and it was found that, on average, it
takes sales teams 22% longer to win an opportunity than they had
expected it to.
The Aberdeen report also found that among the
‘best-in-class’ companies (the ones that enjoyed much higher growth than
everyone else):
81% use performance dashboards to track goal vs. actual sales data
78% have a formal definition of progressive sales stages used to weight sales forecasts
75% add external social media content to the forecasting process
So by being more realistic and using a CRM solution that
joins up sales, marketing, finance and customer service and automates
their processes, your business can have a sales pipeline forecast that
really does convert when you thought it would.
How To Improve Forecasting
1. Sharing
Providing
cross-functional access to the sales forecast was cited as one of the
most important steps that businesses need to take in order to improve
its accuracy. If senior management in other departments have more
information available they can make better decisions. The right CRM
system allows all departments to access full customer data so they can
see exactly what happened before and what’s happening now to make more
informed forecasts for the future.
2. Analysing
Analysis
of ‘deal velocity’ is another way to get better at forecasting. This
just means looking at the extent to which individual sales opportunities
remain in sales stages too long, then working with marketing to improve
the nurturing and selling processes for those accounts, regions or
sectors. With a CRM system that tracks a customer life cycle from lead
to invoice to support, getting hold of this data is simple. And it
provides powerful insights.
3. Pacing
Proper pacing for
effective business-to-business selling can transform results as it helps
to establish where extra support or attention needs to be applied in
order to close a sale. The Aberdeen report showed that only 12% of
laggard companies analyse sales stage activity to identify which deals
were dawdling or racing through the process.
In contrast, 32% of
‘best-in-class’ companies and 41% of ‘industry average’ firms used this
approach and benefited from better overall sales results and more
accurate forecasts by monitoring the sales cycle more closely. Guess
what – the right CRM can reveal the length of sales cycles and what
marketing communications have been used throughout them at the click of a
button.
A nighttime murder took place in
1991 in Linwood, California. Half a dozen teenaged eyewitnesses picked a
man out of a lineup and he was eventually convicted. No gun was ever
found, no vehicle was identified, and no person was ever charged with
driving the vehicle.
For two decades, the convicted man – Francisco Carrillo – maintained his innocence. Eventually, forensic psychologist Scott Fraser
got involved. He reconstructed the crime scene with a focus on the
lighting. He convinced the judge that the eyewitnesses could not
possibly have seen the shooter in the dark well enough to identify him;
the witnesses’ color perception would have been limited and depth of
field would have been no more than 18 inches.
As a result, Carrillo’s murder conviction was overturned and he was released from prison after nearly 20 years.
Scott Fraser told this story in a TEDx talk posted in September 2012, “Why Eyewitnesses Get It Wrong.”
Fraser described how even close-up eyewitnesses can create “memories”
they could not possibly have experienced. He explained an important
characteristic of human memory: the brain only records bits and pieces
of an event or experience.
The different bits are stored in
different parts of the brain. When we recall those bits and pieces, we
have partial recall at best. From inference and speculation and
observations that took place after the event, the brain fills in
information that was not originally stored there. Our memories – all our
memories – are reconstructed.
Reconstructed memories are a
combination of an event and everything that has occurred after the
event. They are reconstructed every time we think of them. As a result
they can change over time. Therefore, the accuracy of a memory can’t be
measured by how vivid it is nor how certain we are that it is correct.
In
this TEDx talk, Fraser made a couple of recommendations for the
criminal justice system. As I was listening to him I thought that these
apply to business decisions just as much as to the law. Fraser
identified two things are really important for decision making:
Hard data. Fraser
urged us all to be cautious about the accuracy of the memories we know
deep in our hearts to be true. Memories are dynamic, malleable, and
volatile. When it comes to workplace decisions, these decisions are very
often made based on eyewitness accounts, in essence – on the experience
and persuasiveness of people. If all our memories – all our experiences
– are reconstructed, our business decisions are just screaming for a
more objective rationale. And that rationale is the evidence that comes
from hard data.
Analytical skills. Fraser
advocates for bringing more science into the courtroom by emphasizing
science, technology, engineering, and mathematics in law schools. After
all, it is law school graduates who become judges. The same is true for
business decision making. The volume of data available for use in
decision making is ballooning and analytical skills are required to make
sense of it. By this I don’t mean we all have to become data scientists.
But we need to be able to apply logical thinking to the gathering and
assessment of information. We need to be able to ask the right
questions.
Which initiatives should we invest in? Where
should we open a new retail store? What is the best way to retain our
most profitable customers? How can we reduce inventory costs? By using
analytical skills and basing decisions upon a combination of hard data
and experience we are best positioned to avoid big mistakes – some of
which could be as significant as sending the wrong guy to jail.
 Google,
which is also clearly trying to get some support from developers and
other vendors with today’s blog post, says that WebP “offers
significantly better compression than these legacy formats (around 35 percent better
in most cases).” As for the Chrome Web Store itself, Google says that
converting the PNGs that it used to use for the large promotional images
in the store to WebP allowed it to reduce image sized by about 30
percent. Given the reach of the store, Google says, this “adds up to
several terabytes of savings every day.”
Google,
which is also clearly trying to get some support from developers and
other vendors with today’s blog post, says that WebP “offers
significantly better compression than these legacy formats (around 35 percent better
in most cases).” As for the Chrome Web Store itself, Google says that
converting the PNGs that it used to use for the large promotional images
in the store to WebP allowed it to reduce image sized by about 30
percent. Given the reach of the store, Google says, this “adds up to
several terabytes of savings every day.”

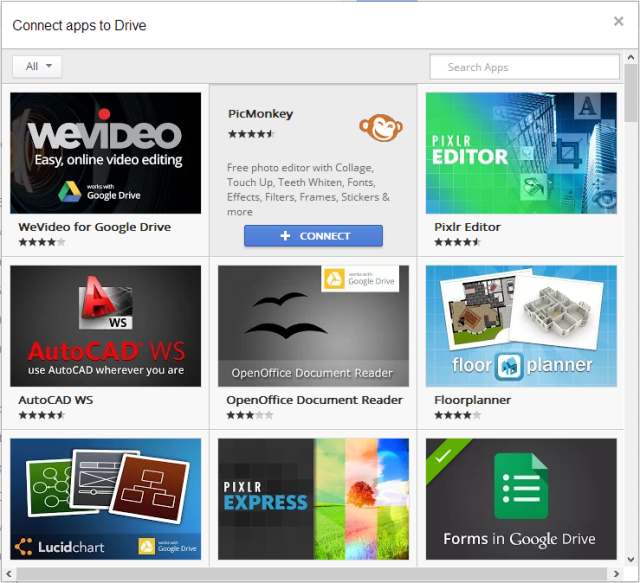 Original Article :http://techcrunch.com/2013/02/08/google-integrates-third-party-web-apps-more-deeply-into-google-drive/
 The problem with big data, in fact, is not unlike the problem with
observational studies in medical research. In observational studies,
statistical relationships are examined on the researcher’s computer. In
double-blind cohort experiments, however, information is extracted in a
way that mimics real life. The former produces all manner of results
that tend to be spurious (as last computed by John Ioannidis) more than eight times out of 10.
The problem with big data, in fact, is not unlike the problem with
observational studies in medical research. In observational studies,
statistical relationships are examined on the researcher’s computer. In
double-blind cohort experiments, however, information is extracted in a
way that mimics real life. The former produces all manner of results
that tend to be spurious (as last computed by John Ioannidis) more than eight times out of 10.
 MicroStrategy has a strong presence and compelling use cases in the pharmaceuticals industry, with solutions around mobile
sales force enablement where operating smatrtphones and tables is a
priority today. This area can show tremendous productivity gains, as
in-meeting effectiveness often requires fast and easy access to pricing,
distribution and benchmark data. The ability to communicate with other
team members in real time during the sales process and to conduct
transactions on the spot can reduce sales cycle times. Ancillary
benefits include providing an audit trail of the best sales processes
and representatives, so that, much like in the retail environment,
pharmaceutical companies can develop and replicate a best-in-class
approach.
MicroStrategy has a strong presence and compelling use cases in the pharmaceuticals industry, with solutions around mobile
sales force enablement where operating smatrtphones and tables is a
priority today. This area can show tremendous productivity gains, as
in-meeting effectiveness often requires fast and easy access to pricing,
distribution and benchmark data. The ability to communicate with other
team members in real time during the sales process and to conduct
transactions on the spot can reduce sales cycle times. Ancillary
benefits include providing an audit trail of the best sales processes
and representatives, so that, much like in the retail environment,
pharmaceutical companies can develop and replicate a best-in-class
approach. In sum, MicroStrategy is pressing its advantage in mobile
intelligence solutions and is figuring out ways to drive that advantage
into the mobile applications market. It is investing heavily in
enterprise business intelligence applications in the cloud, where it
already has more than 40 customers. It has an industry-leading business
intelligence toolkit and was ranked as a hot vendor in our 2012 Business Intelligence Value Index.
In sum, MicroStrategy is pressing its advantage in mobile
intelligence solutions and is figuring out ways to drive that advantage
into the mobile applications market. It is investing heavily in
enterprise business intelligence applications in the cloud, where it
already has more than 40 customers. It has an industry-leading business
intelligence toolkit and was ranked as a hot vendor in our 2012 Business Intelligence Value Index.


